Marathon Digital Holdings Price News: Will MARA stock go up? Key technical levels
- MARA falls in sympathy with Bitcoin's weekend slump.
- Marathon Digital Holdings finished Monday a sharp 8% lower.
- MARA technical indicators giving bearish signals.

Marathon Digital Holdings is a cryptocurrency mining company, formerly called Marathon Patent Group. MARA has two main areas of operation. Montana in the US, where it operates a data centre and also North Dakota where MARA has a site with Bitcoin mining machines in operation.
MARA stock forecast
MARA is then obviously highly correlated to the price of cryptocurrencies and Bitcoin in particular. However, MARA has a much higher volatility than Bitcoin, and that is some achievement in the current market conditions. As we can see from the chart below, since the start of January 2021, Bitcoin has appreciated nearly 64% while MARA is up by 161%.
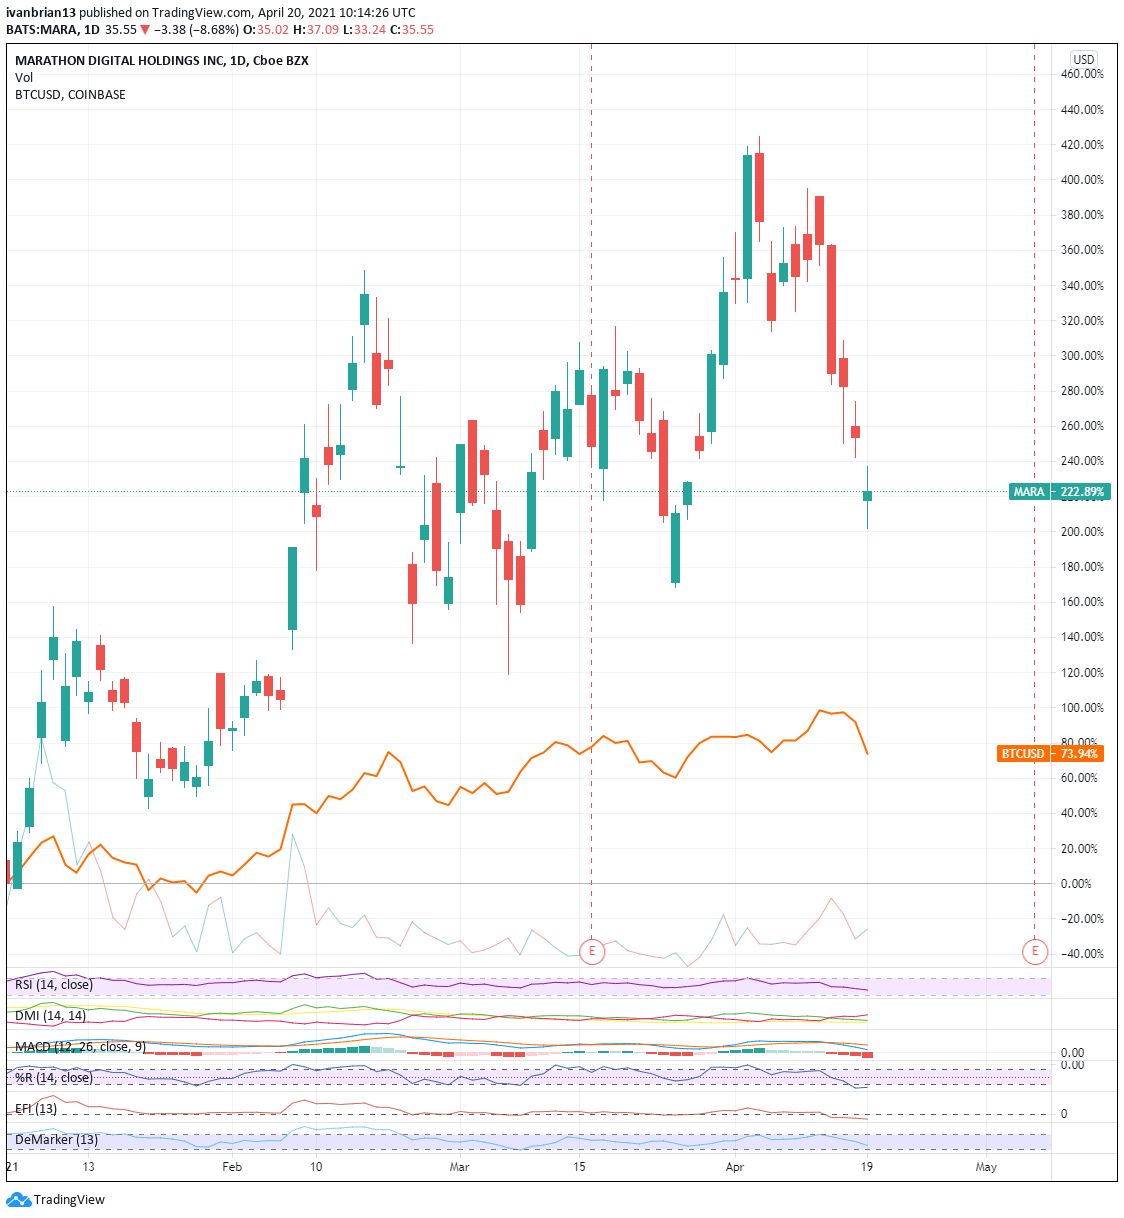
Bitcoin suffered over the weekend as rumours swirled on Twitter and other social media sites that US regulators were about to investigate cryptocurrency use in criminal activities. Turkey also did not help the crypto sector by announcing a ban on cryptocurrency use.
Marathon Digital Holdings, despite Monday's steep fall, still has a market capitalization of $3.51 billion, based on revenue of just $4.38 million. That is some multiple. In 2019, MARA had revenue of $1.19 million. MARA has not turned a profit since 2016. So, this stock is clearly way overvalued fundamentally. The advice is to avoid investing in it for the long term. But not all trades are for the long term, short-term momentum traders just want something that is moving and MARA certainly fits that requirement.
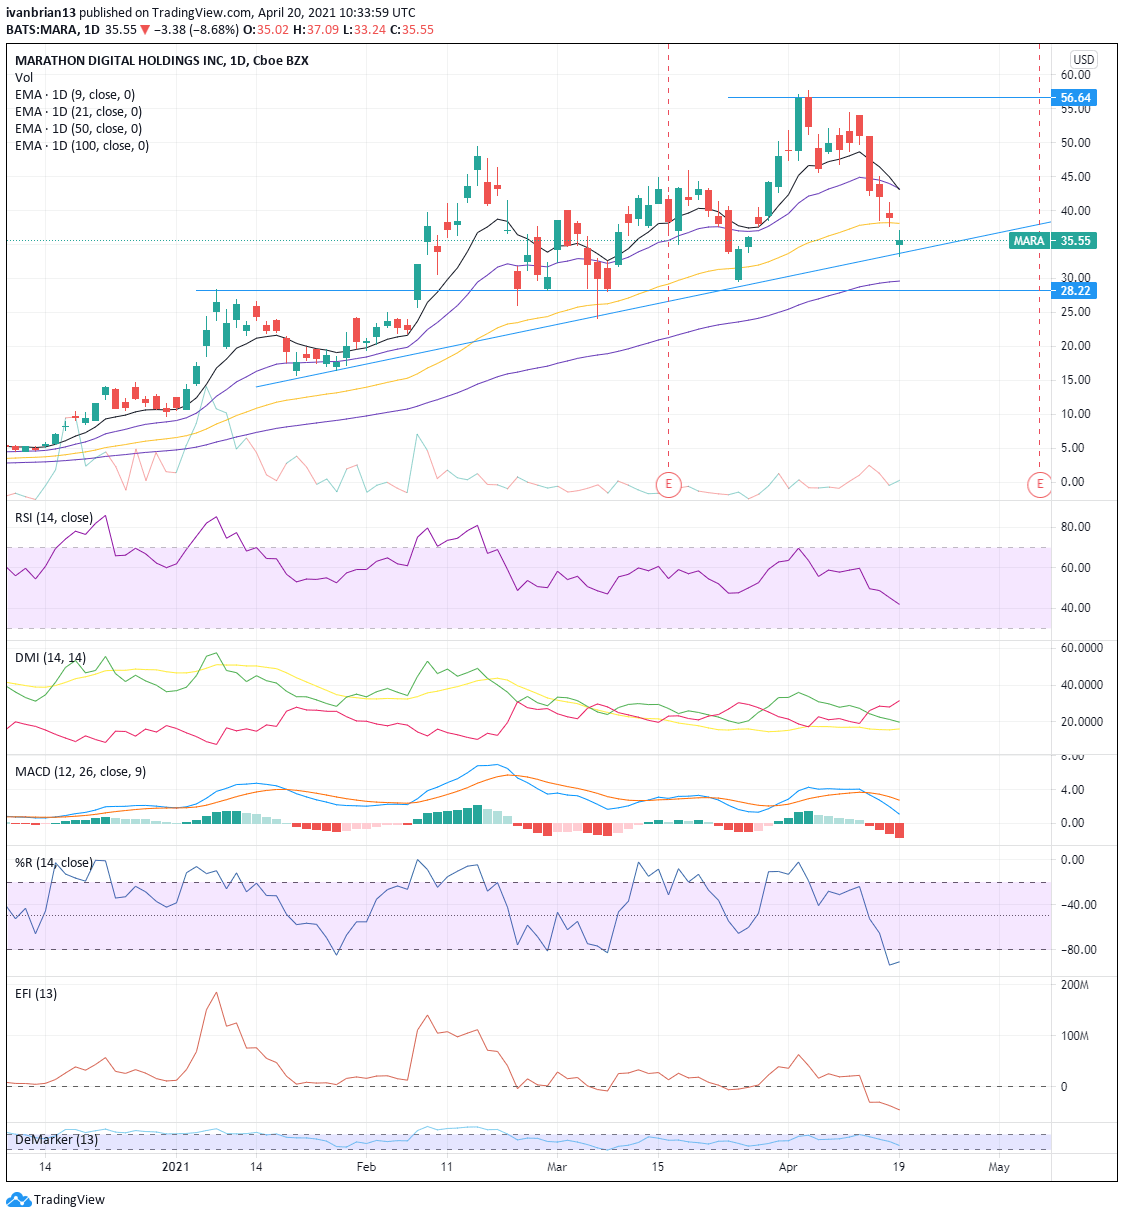
The daily chart for MARA is currently giving a more bearish outlook as the MACD and Directional Movement Index (DMI) crossed over on April 14.
MARA is currently sitting on trendline support, extending across all major recent lows. A break of this trend would be a further negative, which would be confirmed with a breach of $28.22, ending the series of higher lows. A break of this support would also result in the 100-day moving average being broken, another negative. Given the 9 and 21-day moving averages have already been broken and that they have crossed, that means the short-term trend is definitely more bearish.
Taking short positions and looking for a break of the trend line, or taking a short position on a pullback to the 50-day moving average can be used as entry positions. In both cases, breaking back above the 50-day moving average should end the trade, so use a stop just above.
Given the recent short squeezes across many retail meme stocks, the best way to take bearish positions is to use options, as these limit the downside and avoid short squeeze issues. With MARA volatility and volume dropping, option put prices will also be reduced.
For those looking to take long positions, one can be taken at the trend line support ($34) with a tight stop on a break of this. The first target would be the 50-day MA and then the 9 and 21-day MAs, followed by ultimate resistance at $56.64. Further long positions can be tried at the 100-day moving average support ($29.61), again with a tight stop on a break of this level.
At the time of writing, the author has no position in any stock mentioned in this article and no business relationship with any company mentioned. The author has not received compensation for writing this article, other than from FXStreet.
This article is for information purposes only. The author and FXStreet are not registered investment advisors and nothing in this article is intended to be investment advice. It is important to perform your own research before making any investment and take independent advice from a registered investment advisor.
FXStreet and the author do not provide personalized recommendations. The author makes no representations as to accuracy, completeness, or the suitability of this information. FXStreet and the author will not be liable for any errors, omissions or any losses, injuries or damages arising from this information and its display or use. The author will not be held responsible for information that is found at the end of links posted on this page.
Errors and omissions excepted.
Premium
You have reached your limit of 3 free articles for this month.
Start your subscription and get access to all our original articles.
Author

Ivan Brian
FXStreet
Ivan Brian started his career with AIB Bank in corporate finance and then worked for seven years at Baxter. He started as a macro analyst before becoming Head of Research and then CFO.


