Marathon Digital Holdings (MARA) Stock Forecast: It's a marathon not a sprint
- MARA stock drops over 5% on Thursday as Bitcoin wobbles.
- The crypto sector is still one of the hottest in town.
- The BTC mining company is still bullish holding above key levels.

Marathon Digital stock suffered a pretty steep fall on Thursday giving up over 5% to close at $36.22. The stock has been strong of late, however, riding the coattails of a double tailwind in the form of record-high equity prices and Bitcoin remaining strong near $50,000. Equity markets have slowed ahead of today's Jackson Hole summit and Bitcoin has recently broken back below $50,000. So, is MARA now about to hit the wall?
Meme stocks came back to the fore last week with some spectacular gains. Both AMC and GameStop (GME) rose over 20% in a breakout. There has been a strong negative correlation between meme stocks and Bitcoin for most of the year as both have strong interest from retail traders. When either Bitcoin or meme stocks are hot, traders appear to bail out of one asset and rush into the other. This correlation proved accurate again as Bitcoin slumped through the key $50,000 level as the meme stock renaissance took hold.
Meme stocks have since slowed though with the overall equity market taking a break and waiting to see what central bank comments come out of the Jackson Hole symposium on Friday. This is the key to future direction. If the tone is reasonably bullish and risk is back on expect to see further meme stock bullishness and likely Bitcoin falling further. This obviously sets the tone for MARA stock and others in the sector.
MARA statistics
| Market Cap | $3.6 billion |
| Price/Earnings | |
| Price/Sales | 716 |
| Price/Book | 10 |
| Enterprise Value | $2.75 billion |
| Gross Margin | -0.77 |
| Net Margin |
-0.78 |
| 52 week high | $57.75 |
| 52 week low | $1.48 |
| Average Wall Street Rating and Price Target | Buy $50.67 |
MARA stock forecast
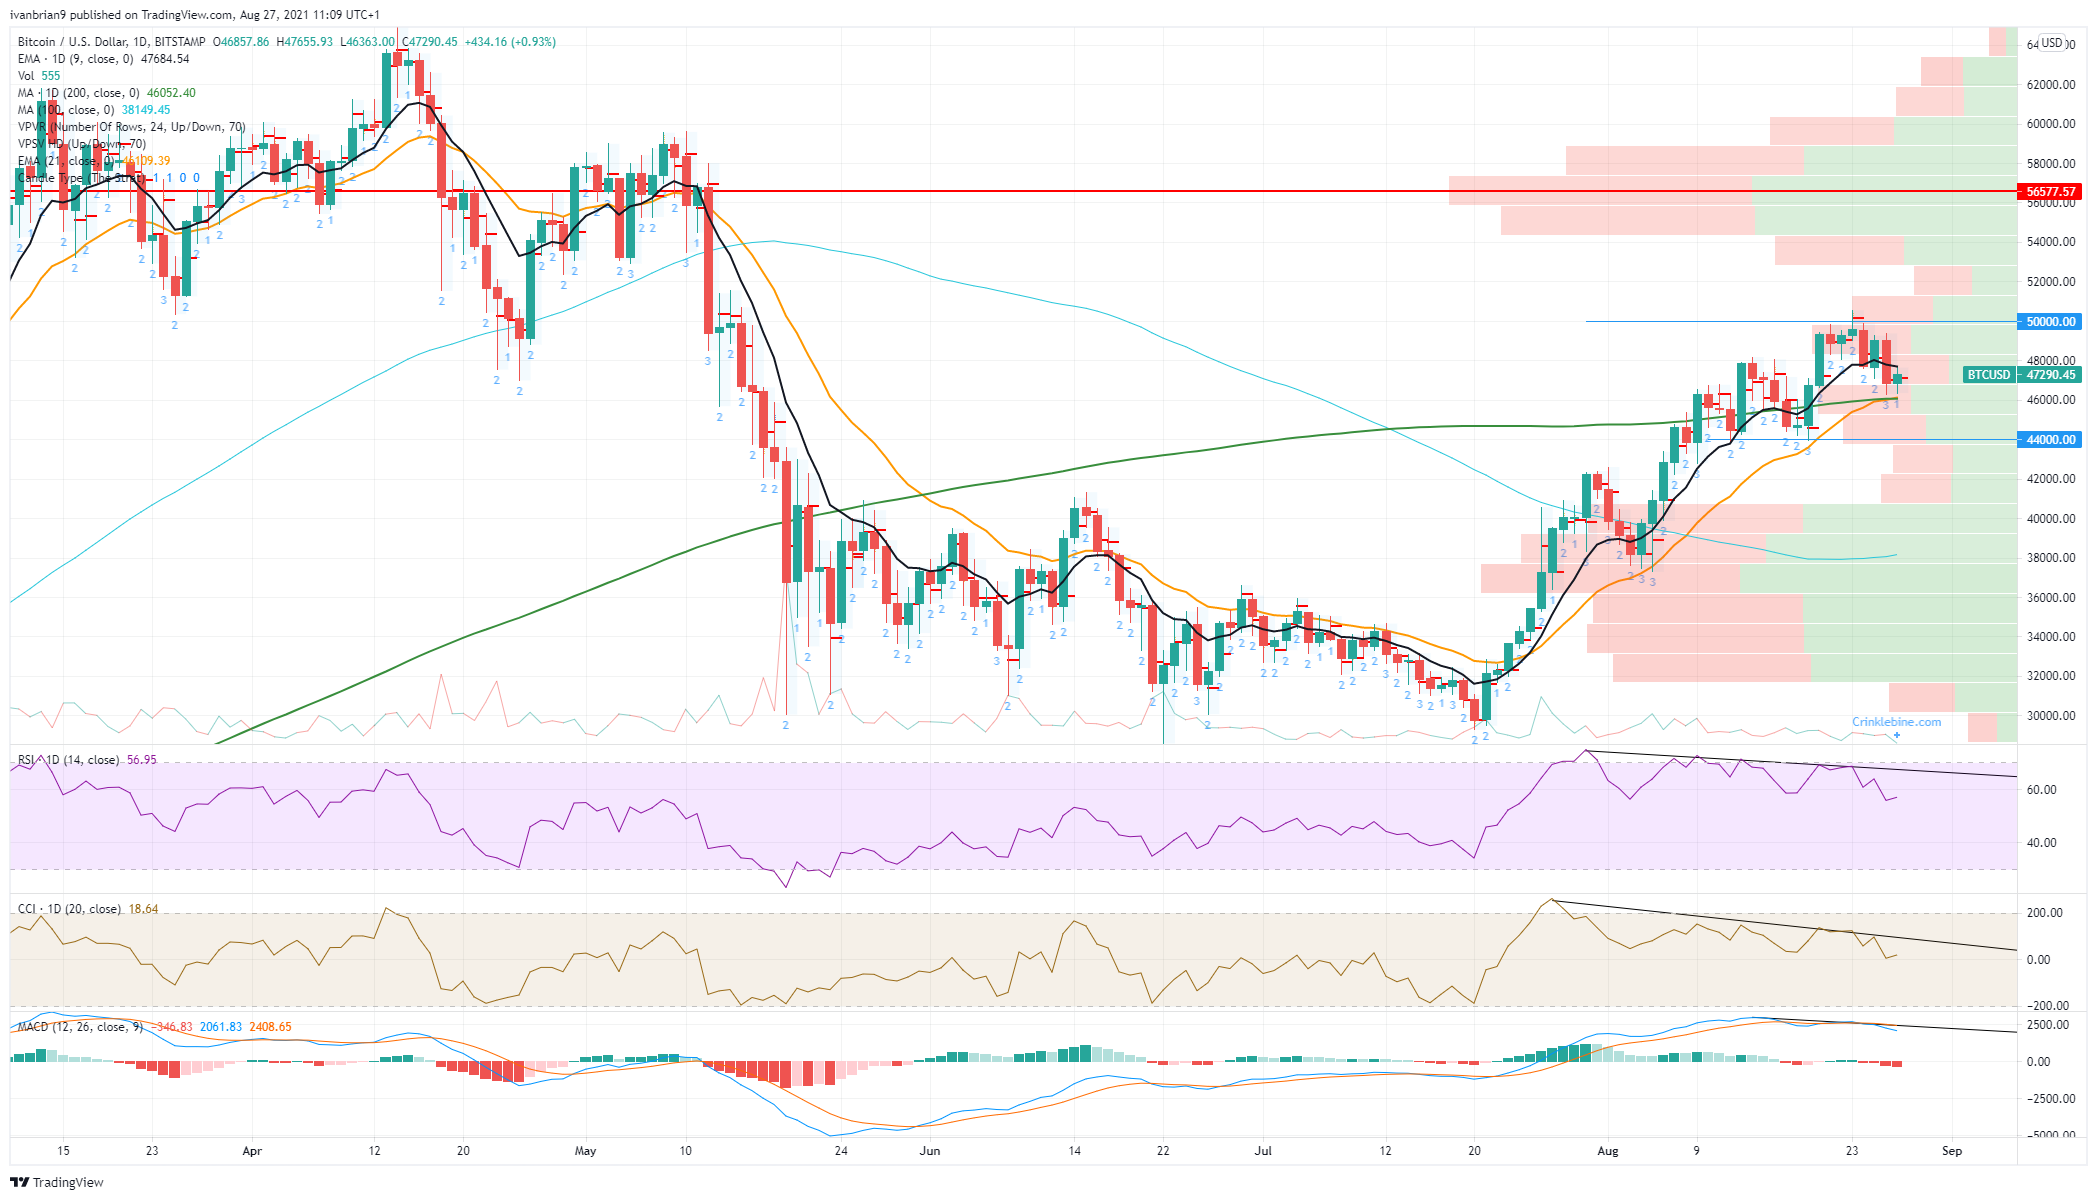
Let us first take a look at Bitcoin for the sector picture as this sets the tone for MARA. We can see from the chart just how important $50,000 is. Not just a psychological level but also a strong resistance. Bitcoin has been trying to break through for nearly two weeks now. We have bearish divergences from the Moving Average Convergence Divergence (MACD), Relative Strength Index (RSI), and the Commodity Channel Index (CCI). As mentioned if meme stocks continue their renaissance then money could be attracted from Bitcoin back to the meme stock space.
Bitcoin (BTC) price forecast
The $44000 mark remains key to the downside if this goes then Bitcoin is back in bearish territory. Breaking $50,000 sets the crypto king up for a move to $57,000.
MARA stock price forecast
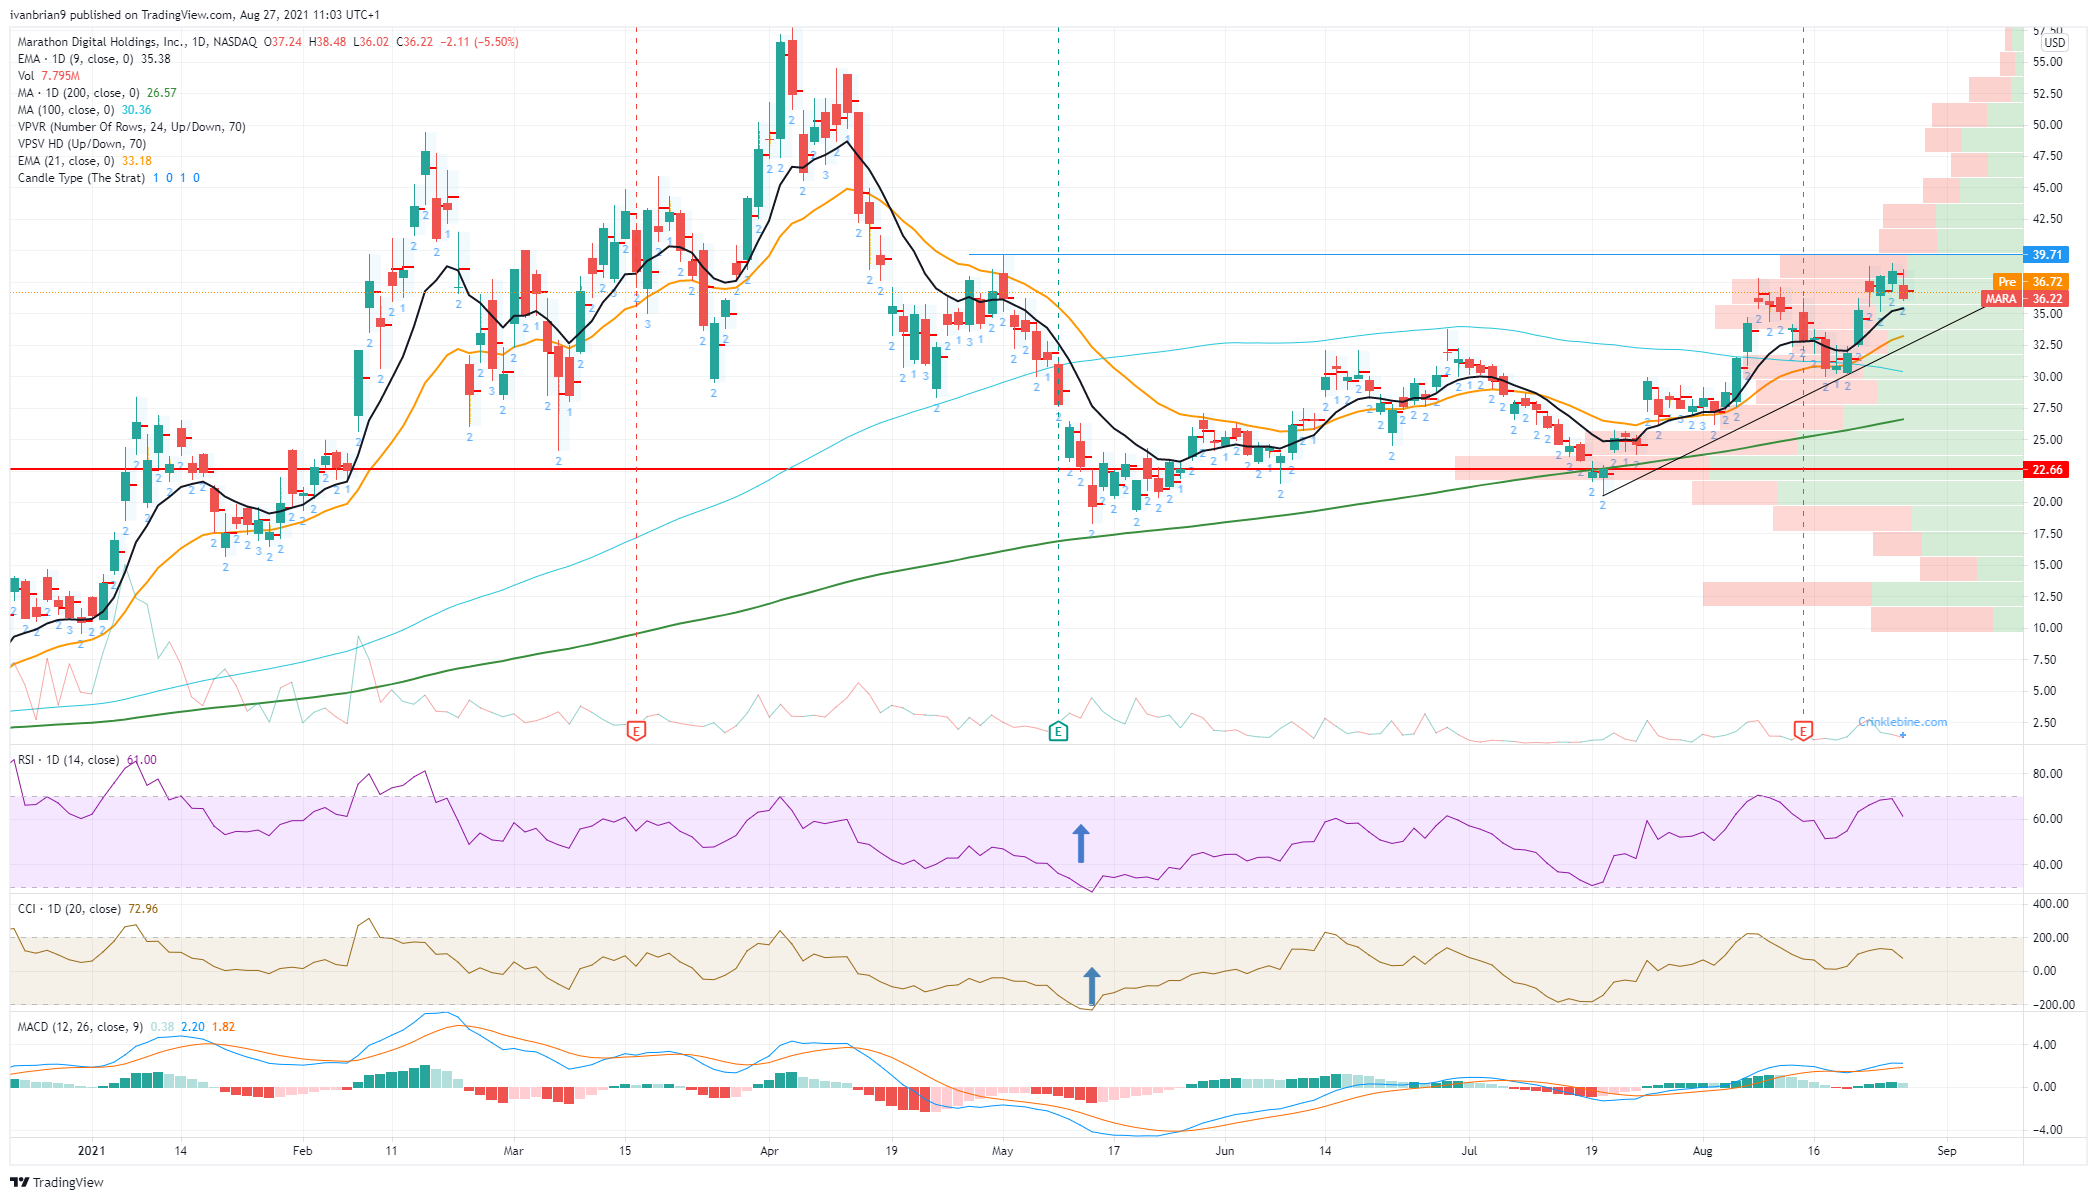
MARA remains in a bullish formation with a series of lower lows and higher highs going back to late May. The key support, so we do not make a fresh low, is $30.10, close enough to a psychological round number. Holding above $30 means MARA can have a look at breaking resistance at $39.68 the high from late April. Above $39.68, volume thins out, meaning a move higher could be fast or accelerate through the level. If MARA breaks below $30, then in our opinion the level to wait for is $22.66, the point of control since the breakout in January. This is the price with the highest volume and it represents an equilibrium.
Like this article? Help us with some feedback by answering this survey:
Premium
You have reached your limit of 3 free articles for this month.
Start your subscription and get access to all our original articles.
Author

Ivan Brian
FXStreet
Ivan Brian started his career with AIB Bank in corporate finance and then worked for seven years at Baxter. He started as a macro analyst before becoming Head of Research and then CFO.


