HeidelbergCement is a German multinational building materials company. Today, it is the largest producer of construction aggregates in the world. It is number 2 in production of cement and number 3 worldwide in ready mixed concrete. Founded in 1874 and headquartered in Heidelberg, Germany, HeidelbergCement is a part of DAX40 index. One can trade it under the ticker $HEI at XETRA.

In the initial article from October 2021, we have explained that the pullback from April 2021 offers an opportunity. Later, in August 2022, we have identified next support area. The price has reached that area and shows a reaction higher in 5 waves. In the present article, we provide an update while discussing price patterns and targets.

HeidelbergCement monthly Elliott Wave analysis 04.12.2023

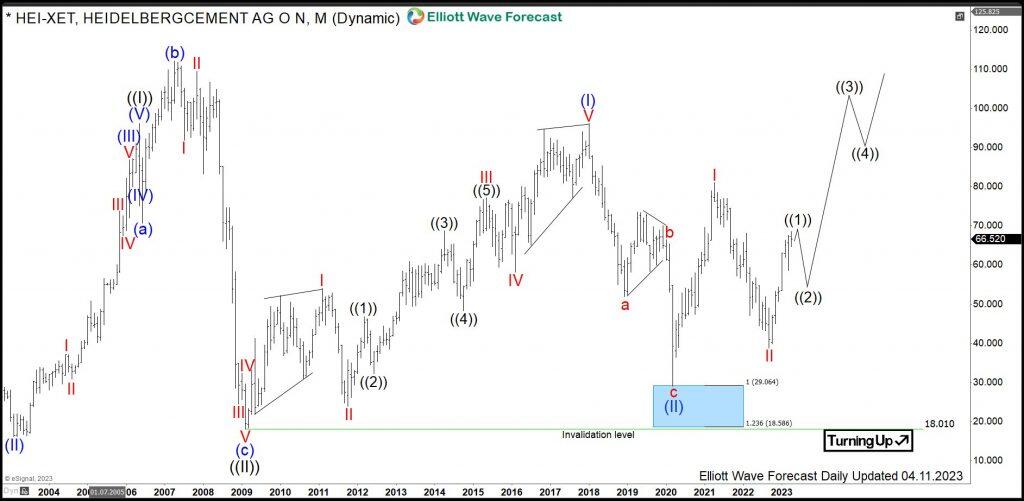
The monthly chart below shows the HeidelbergCement stock $HEI traded at XETRA. From all-time lows, the stock price has developed a strong initial nest. Just to recall: A nest is a sum of waves 1 and 2 of the same degree. First, black wave ((I)) has ended in May 2006 at 96.11. Then, wave ((II)) has corrected the cycle higher within an expanded flat structure lower. Hereby, wave (b) of ((II)) has printed the all-time highs in April 2007 at 112.03. The consolidation within wave ((II)) has ended in February 2009 at 18.01.

From February 2009 low, a new cycle in wave ((III)) has started. Break above 112.03 highs will confirm that. Within wave ((III)), $HEI is showing a series of nests. First, waves (I)-(II) have ended on March 2020 at 29.00. From there, a second nest is also in place. First, red wave I has ended in April 2021 at 81.04. Then, red wave II has found a bottom in September 2022 at 38.73 lows. While above there, acceleration higher in red III of blue wave (III) of black wave ((III)) is taking place.

Chart

HeidelbergCement daily Elliott Wave analysis 04.12.2023

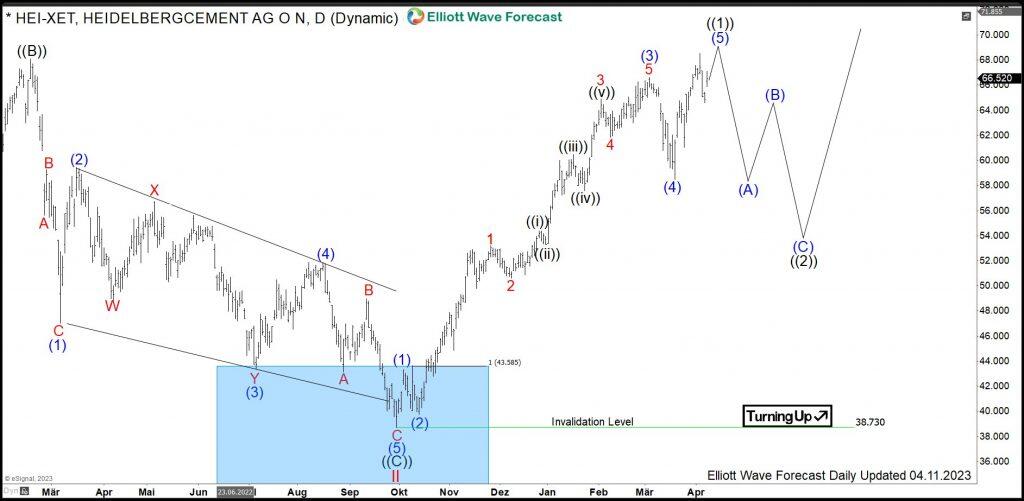
The Daily chart below shows in more detail the pullback in wave II from the April 2021 peak at 81.04 and reaction higher within wave III from the blue box area. The consolidation pattern in red wave II is most likely a zigzag pattern. First, impulse in black wave ((A)) has found its bottom in December 2021 at 56.60. Then, a bounce in black wave ((B)) has set connector in February 2022 at 68.08 (both not shown). From there, ending diagonal in wave ((C)) being 3-3-3-3-3 structure has reached into 43.59-29.00 blue box area.

Investors and traders who bought $HEI from 43.59-29.00 area could enjoy the rally in red wave III and should further stay long. The advance from 38.73 lows in black wave ((1)) of red wave III looks mature. Soon, a pullback in black wave ((2)) should allow joining the rally. Hereby, one can buy dips in $HEI in 3, 7, 11 swings against 38.73 lows. Once wave ((2)) ended, further acceleration higher in black wave ((3)) of red wave III should take place. The target for red wave III is 90.68-122.83 area and beyond. As an outlook, blue wave (III) of ((III)) should extend towards 107.22-155.52 area and possibly higher. The target for the entire wave ((III)) will be 114.42-174.01 area. Buying dips in $HEI offer, therefore, a high profit potential for those who would like to diversify their portfolio by indirect investment in commodities and construction business.

Chart

Share: Feed news

FURTHER DISCLOSURES AND DISCLAIMER CONCERNING RISK, RESPONSIBILITY AND LIABILITY Trading in the Foreign Exchange market is a challenging opportunity where above average returns are available for educated and experienced investors who are willing to take above average risk. However, before deciding to participate in Foreign Exchange (FX) trading, you should carefully consider your investment objectives, level of xperience and risk appetite. Do not invest or trade capital you cannot afford to lose. EME PROCESSING AND CONSULTING, LLC, THEIR REPRESENTATIVES, AND ANYONE WORKING FOR OR WITHIN WWW.ELLIOTTWAVE- FORECAST.COM is not responsible for any loss from any form of distributed advice, signal, analysis, or content. Again, we fully DISCLOSE to the Subscriber base that the Service as a whole, the individual Parties, Representatives, or owners shall not be liable to any and all Subscribers for any losses or damages as a result of any action taken by the Subscriber from any trade idea or signal posted on the website(s) distributed through any form of social-media, email, the website, and/or any other electronic, written, verbal, or future form of communication . All analysis, trading signals, trading recommendations, all charts, communicated interpretations of the wave counts, and all content from any media form produced by www.Elliottwave-forecast.com and/or the Representatives are solely the opinions and best efforts of the respective author(s). In general Forex instruments are highly leveraged, and traders can lose some or all of their initial margin funds. All content provided by www.Elliottwave-forecast.com is expressed in good faith and is intended to help Subscribers succeed in the marketplace, but it is never guaranteed. There is no “holy grail” to trading or forecasting the market and we are wrong sometimes like everyone else. Please understand and accept the risk involved when making any trading and/or investment decision. UNDERSTAND that all the content we provide is protected through copyright of EME PROCESSING AND CONSULTING, LLC. It is illegal to disseminate in any form of communication any part or all of our proprietary information without specific authorization. UNDERSTAND that you also agree to not allow persons that are not PAID SUBSCRIBERS to view any of the content not released publicly. IF YOU ARE FOUND TO BE IN VIOLATION OF THESE RESTRICTIONS you or your firm (as the Subscriber) will be charged fully with no discount for one year subscription to our Premium Plus Plan at $1,799.88 for EACH person or firm who received any of our content illegally through the respected intermediary’s (Subscriber in violation of terms) channel(s) of communication.

Recommended content


Recommended content

Editors’ Picks

EUR/USD nears 1.0800 on broad US Dollar weakness

EUR/USD nears 1.0800 on broad US Dollar weakness

Optimism continues to undermine demand for the American currency ahead of the weekly close. EUR/USD hovers around weekly highs just ahead of the 1.0900 figure.

EUR/USD News

GBP/USD reconquers 1.2500 with upbeat UK GDP

GBP/USD reconquers 1.2500 with upbeat UK GDP

Following BOE-inspired slump on Thursday, the British Pound changed course and trades around 1.2530. Better-than-anticipated UK GDP and a weaker USD behind the advance.

GBP/USD News

Gold resumes advance and trades above $2,370

Gold resumes advance and trades above $2,370

XAU/USD accelerated its recovery on Friday, as investors drop the USD. Dismal US employment-related figures revived hopes for a soon-to-come rate cut from the Fed.

Gold News

XRP tests support at $0.50 as Ripple joins alliance to work on blockchain recovery

XRP tests support at $0.50 as Ripple joins alliance to work on blockchain recovery

XRP trades around $0.5174 early on Friday, wiping out gains from earlier in the week, as Ripple announced it has joined an alliance to support digital asset recovery alongside Hedera and the Algorand Foundation. 

Read more

Euro area annual inflation is expected to be 2.4% in April 2024

Euro area annual inflation is expected to be 2.4% in April 2024

Euro area annual inflation is expected to be 2.4% in April 2024, stable compared to March. Looking at the main components of euro area inflation, services is expected to have the highest annual rate in April.

Read more

Forex MAJORS

Cryptocurrencies

Signatures