|

Gold technical analysis: Yellow metal off multi-year highs, challenging 1,530.00 support

  • Gold is retreating this Monday on the back of easing trade tensions between the US and China. 

  • The level to beat for sellers is $1,530.00/oz and 1,510.00 support.


Gold daily chart


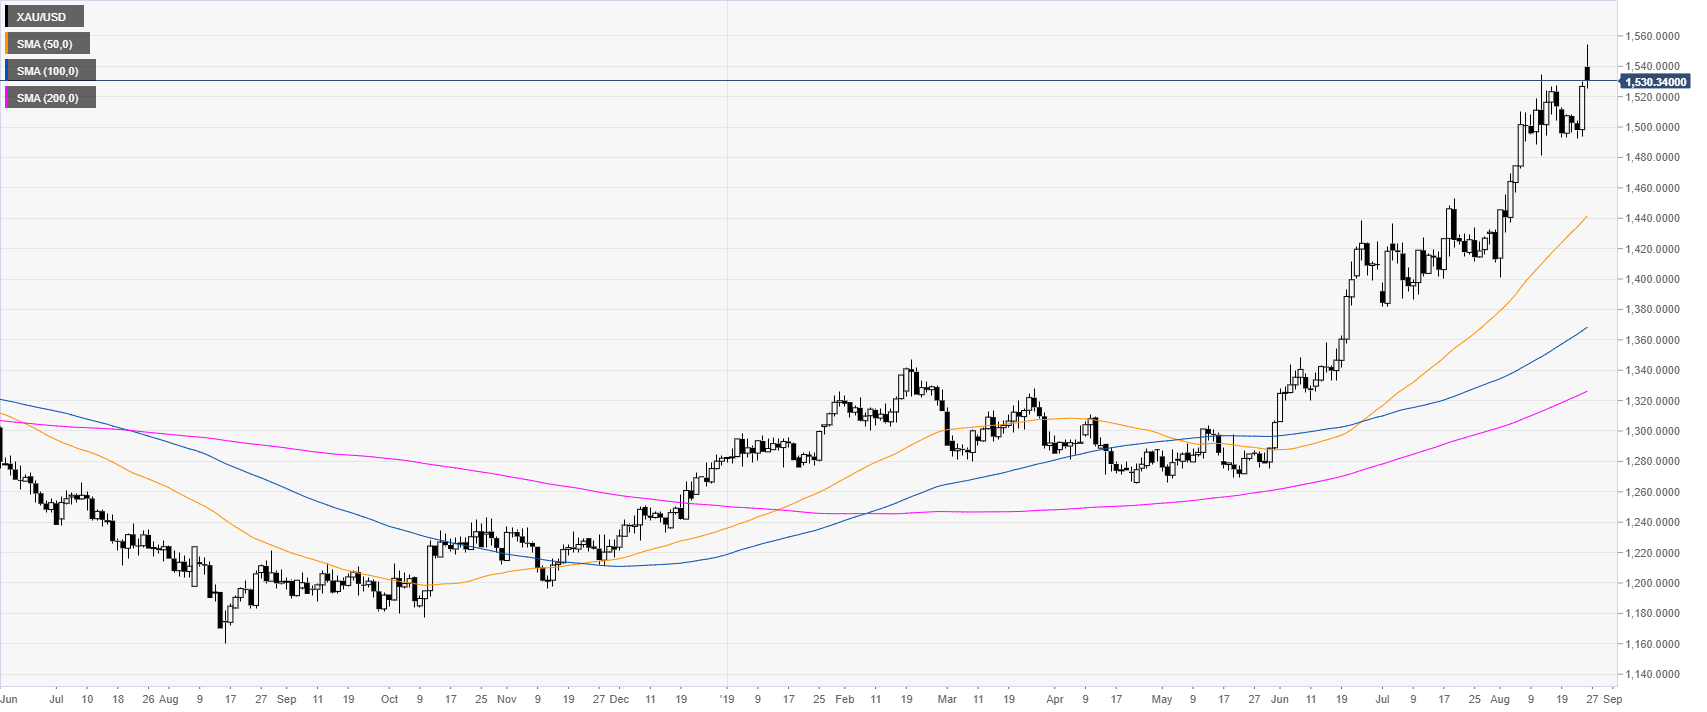
Gold is off multi-year highs after peaking at 1,554.63 earlier this Monday. Both China and the US appear willing to negotiate, therefore decreasing the demand for the safe-haven non-yielding asset. 
 

Gold 4-hour chart


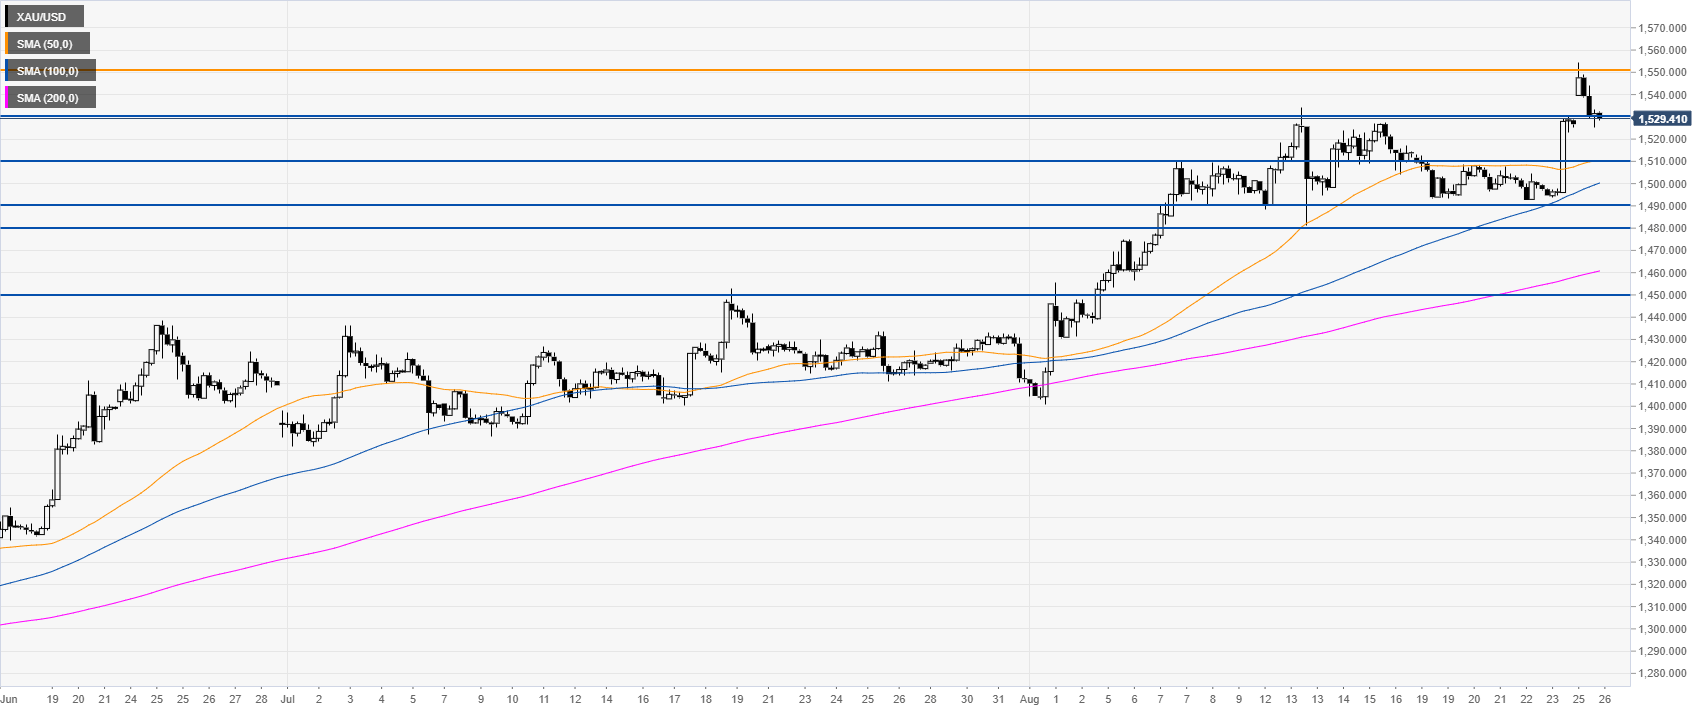
The yellow metal closed the weekly gap as the market is hovering near 1,530.00. Bulls would need to defend this level to create a potential move up towards 1,550.00 resistance.
Gold 30-minute chart

 
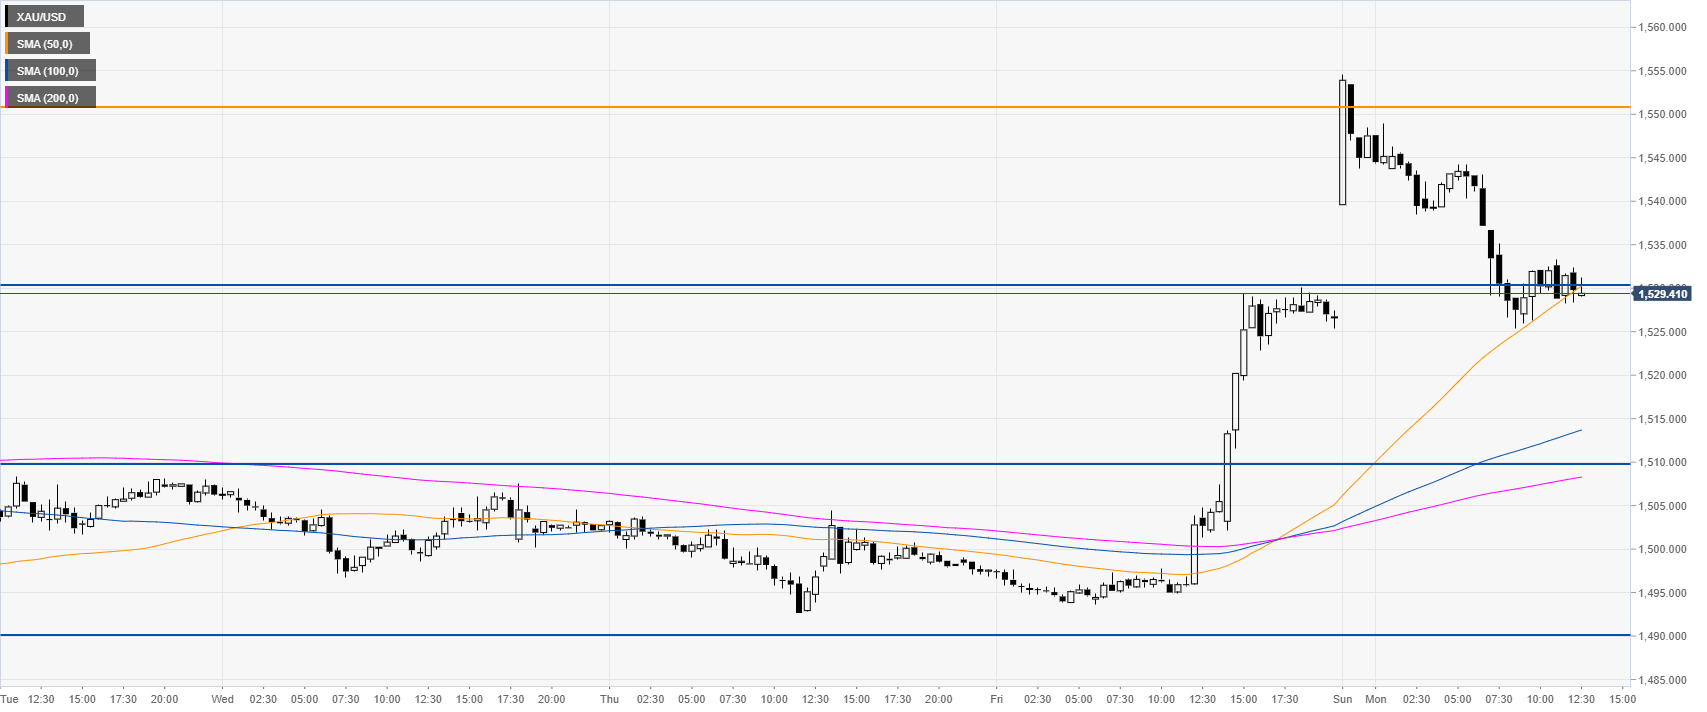
Gold is challenging the 1,530.00 support and the 50 SMA. If the sellers keep the pressure on the metal, the market could reach 1,510.00 and 1,490.00 to the downside. 
 

Additional key levels 

XAU/USD

Overview
Today last price1530
Today Daily Change3.30
Today Daily Change %0.22
Today daily open1526.7
 
Trends
Daily SMA201484.52
Daily SMA501437.72
Daily SMA1001365.9
Daily SMA2001324.62
Levels
Previous Daily High1530.05
Previous Daily Low1493.65
Previous Weekly High1530.05
Previous Weekly Low1492.65
Previous Monthly High1452.72
Previous Monthly Low1382.02
Daily Fibonacci 38.2%1516.15
Daily Fibonacci 61.8%1507.55
Daily Pivot Point S11503.55
Daily Pivot Point S21480.4
Daily Pivot Point S31467.15
Daily Pivot Point R11539.95
Daily Pivot Point R21553.2
Daily Pivot Point R31576.35

Author

Flavio Tosti

Flavio Tosti

Independent Analyst


More from Flavio Tosti

Share:

Editor's Picks

GBP/USD dips below 1.3350 as USD demand surges

GBP/USD extends its intraday slide and closes in on 1.3300 in the American session on Thursday. The pair remains under heavy bearish pressure as the US Dollar (USD) benefits from the risk-averse market atmosphere amid escalating geopolitical tensions in the Middle East.

EUR/USD drops toward 1.1350 post ECB decision

EUR/USD remains under heavy bearish pressure in the second half of the day on Thursday and trades at its lowest level in three weeks below 1.1370. The ECB's cautious tone on policy tightening in the near future and the broad-based US Dollar (USD) strength on risk-aversion drag the pair lower.

Gold trims gains, dips to $4,050

Gold keeps retreating on Thursday, trading well below $4,100 early in the American session. US crude oil prices climb to a fresh six-week high above $90 amid a further escalation of tensions between the US and Iran, fueling inflation fears and bolstering US Fed interest rate hike expectations. Hawkish Fed bets weigh negatively on the yieldless bullion.

XRP Price Forecast: XRP trades sideways as Ripple targets 10 million agentic AI transactions
Ripple (XRP) is losing momentum on Thursday, albeit gradually, trading above $1.13. The remittance token tagged a weekly high of $1.16 on Tuesday, with gains mainly attributed to developments on the United States (US) Clarity Act and recent signs that inflation is easing in the world’s largest economy.
Bitcoin falls as surging Oil prices revive inflation concerns

Bitcoin extends its correction, trading below $65,800 after a modest decline in the previous day. Despite BTC’s fading strength, US-listed spot Bitcoin Exchange Traded Funds continued to attract institutional inflows on Wednesday, marking the seventh consecutive day of gains.

US Dollar mid-year outlook: Exceptional currency, exceptional risks?
The US Dollar enters the second half of 2026 in a markedly different position from a year ago. The King currency has recovered, reflecting persistent US inflation, changing expectations for Fed policy, geopolitical tensions and renewed demand for defensive assets.
















