Gold Price News and Forecast: XAU/USD trapped in an ascending triangle

Gold Price Analysis: Bullish bias intact while above critical $1777 support
Gold consolidated the recent bullish momentum and remained within a striking distance of the seven-year highs of $1789.28 reached last week. The bulls seemed undeterred by the risk-on rally in the global stocks amid underlying COVID concerns. A test of $1800 mark on the cards?
The Technical Confluences Indicator shows that the yellow metal is ranging just below the critical resistance at $1787.70, which is likely capping the immediate upside. That barrier is the previous month high. On a break above the latter, a test of the multi-year highs near $1790 is inevitable, where the pivot point one-day R1 and pivot point one-week R1 coincide.

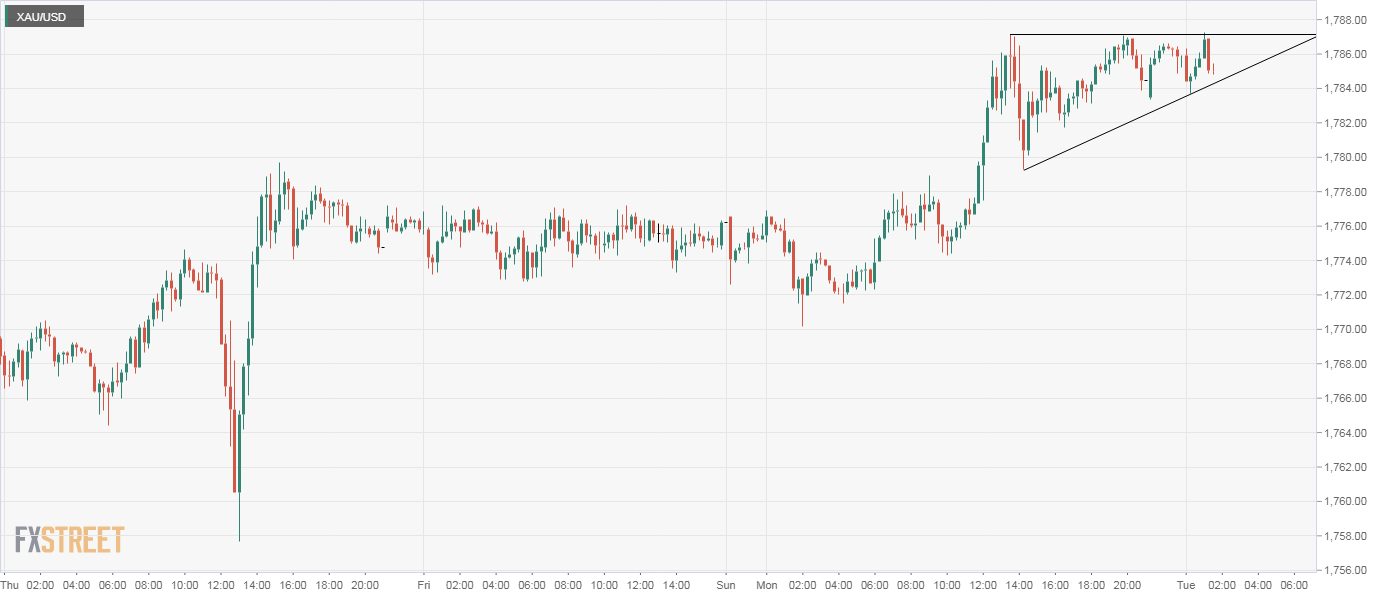
Gold Price Analysis: Trapped in an ascending triangle
Gold is currently trading at $1,784 per ounce, representing a 0.11% gain on the day, having tested Monday’s high of $1,787 soon before press time. The yellow metal has carved out an ascending triangle on the 15-minute chart, which comprises trend lines connecting higher lows and a horizontal resistance level.
The ascending triangle is a bullish continuation pattern that usually forms during an uptrend, which seems to be the case here. Gold has formed the ascending triangle at eight-year highs.
A breakout would expose the psychological resistance of $1,800. Alternatively, a downside break of the ascending triangle would shift risk in favor of a deeper pullback to $1,775. At press time, the lower end of the triangle is located at $1,783.
Read more ...
Author

FXStreet Team
FXStreet


