Gold price hovers around an 11-month low at $1,690 despite weaker DXY, ECB policy eyed
- Gold price has printed a fresh 11-month low near $1,690.00 despite a weaker DXY.
- The precious metal and DXY are reacting against their universal negative relationship.
- The odds of a recession have accelerated as the US job market may suffer from lower demand.

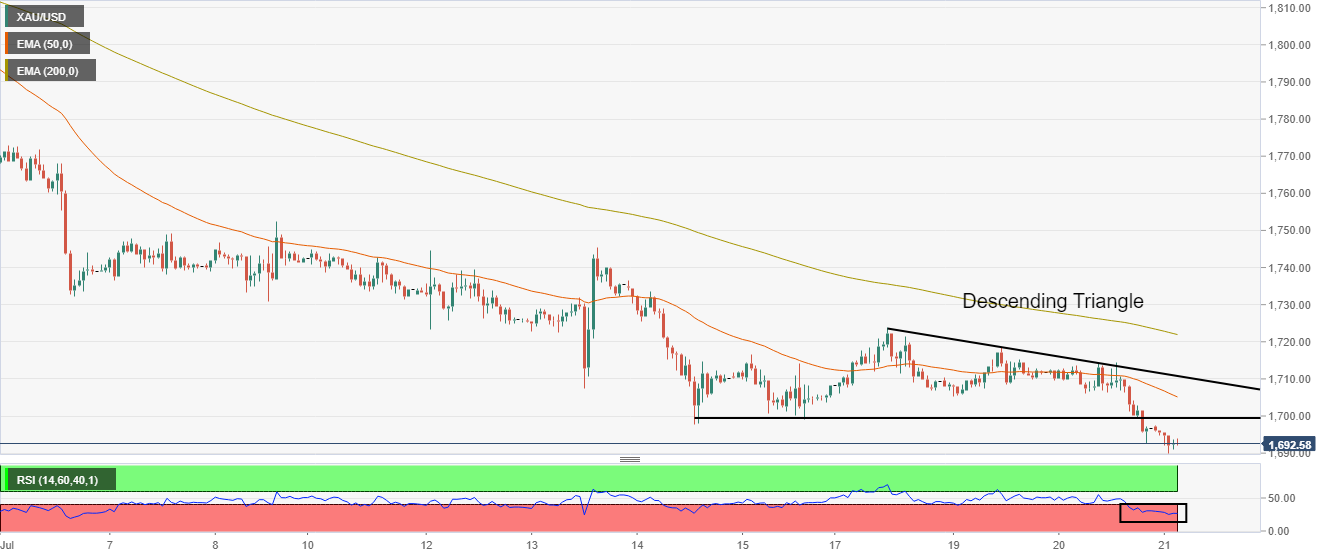
Gold price has settled below the psychological support of $1,700.00 firmly. The precious metal has printed a fresh 11-month low at $1,690.04 and is expected to display more downside as the asset has not displayed any recovery signs yet. It is worth noting that the asset has broken the volatility contraction to the downside and bears are unleashed. The bright metal is set to recapture its yearly lows, which are placed at $1,687.78.
On the dollar front, the US dollar index (DXY) has failed to turn the pullback move into a bullish reversal and is eyeing the south-side direction. The asset faced barricades around 107.26 and has surrendered the critical support of 107.00. A decisive downside move below Wednesday’s low at 106.39 will strengthen the bears further and the DXY will shift its cushion lower initially at around 105.00.
Also Read: Gold Price Forecast: Bears looking for fresh 2022 lows under $1,700.00

Gold price and the DXY are opposing their inverse character
Gold price and DXY move downside in tandem
Investors have turned their back on the gold price despite the weakness in the DXY. Usually, gold price and DXY carries an inverse relationship as losses in one asset result in gains for the other. This time, both assets are declining and it would be worth calling ‘gold price’ a weaker asset as rick-perceived currencies are performing stronger. The gold price has printed a fresh 11-month high at $1,690.04.
Recession fears accelerate as Google halts recruitment process
The odds of a recession have accelerated as IT giant Google has halted its recruitment process for the past two weeks. As we are aware of the fact that price pressures are still far from control despite the heavy rate hikes by the central banks. The catalyst which was empowering the central banks to tighten policy unhesitatingly was the tight labor market. Now, expectations of lower headcounts by Google in upcoming quarters also signal lower employment generation in the US. The dual impact of a weak labor market and the impact of higher inflation will affect the US economy.
Gold price to remain vulnerable on hawkish ECB bets
Gold price will face more heat as the European Central Bank (ECB) is expected to announce a rate hike for the first time in 11 years. The street is discussing the extent of a rate hike. Think tanks believe that most probably the ECB will hike its interest rates by 25 basis points (bps) as it will prefer to test the waters first. However, odds of a 50 bps rate are also open as price pressures have crossed the tolerance power of the households in Europe.
S&P Global PMI to remain in focus
Due to a light economic calendar this week, investors’ focus will remain on the release of the S&P Global PMI data. As per the market consensus, the economic catalysts are expected to deliver a weak performance. The Global Composite data is seen at 51.7, lower than the prior release of 52.3. The Manufacturing PMI may slip to 52 vs. 52.7 recorded earlier. While the Services PMI is expected to display a mild correction to 52.6 against the former figure of 52.7. This will keep the DXY on the back foot and may support the shared currency bulls.
-637939713613188285.png)
Gold technical analysis
Gold price has given a downside break of the Descending Triangle that signals a volatility contraction with a downside bias. The downward-sloping trendline of the above-mentioned chart pattern is plotted from July 18 high at $1,723.97 while the horizontal support is placed from June 14 low at $1,697.69.
The 50-and 200-period Exponential Moving Averages (EMAs) at $1,704.86 and $1,722.04 respectively are declining, which adds to the downside filters.
Meanwhile, the Relative Strength Index (RSI) (14) has shifted into the bearish range of 20.00-40.00, which signals more downside ahead.
Gold hourly chart
Gold halts decline, but bearish risks still intact
Author

Sagar Dua
FXStreet
Sagar Dua is associated with the financial markets from his college days. Along with pursuing post-graduation in Commerce in 2014, he started his markets training with chart analysis.