|

Gold Price Forecasts: XAUUSD corrects to near $1,670 as DXY holds gains despite hawkish Fed bets trim

  • Gold price has declined to near $1,670.00 marginally, downside seems restricted amid upbeat risk profile.
  • Trimmed chances of the Fed’s fifth consecutive 75 bps rate hike could weigh on US Treasury yields.
  • The absence of exhaustion signs in core CPI could bring volatility in the global market.

Gold price (XAUUSD) has corrected to near $1,670.00 in the Asian session after failing to sustain above the critical hurdle of $1,680.00. The precious metal has sensed a light selling pressure as the juggernaut gold rally has met with a long liquidation program. The upside potential in the gold price is still solid as the overall market sentiment is extremely cheerful.

Meanwhile, the US dollar index (DXY) is holding its Tokyo gains and is displaying a rangebound structure above 111.00. The 10-year US Treasury yields have suffered a minor decline to nearly 4.15% as the chances of 75 basis points (bps) rate hike by the Federal Reserve (Fed) have trimmed. As per the CME FedWatch tool, the odds favoring a continuation of a bigger rate hike stand at 38.5%.

After the robust payroll data by the US agency, investors are awaiting the release of the Consumer Price Index (CPI) data. As per the preliminary estimates, the headline CPI is seen lower at 8.0% vs. the prior release of 8.2%. While the core CPI that excludes oil and food prices is seen lower at 6.5% against 6.6% recorded earlier.

It is worth noting that the core inflation rate has not displayed signs of serious exhaustion yet, therefore, no meaningful change in core CPI numbers could trigger volatility in the markets.

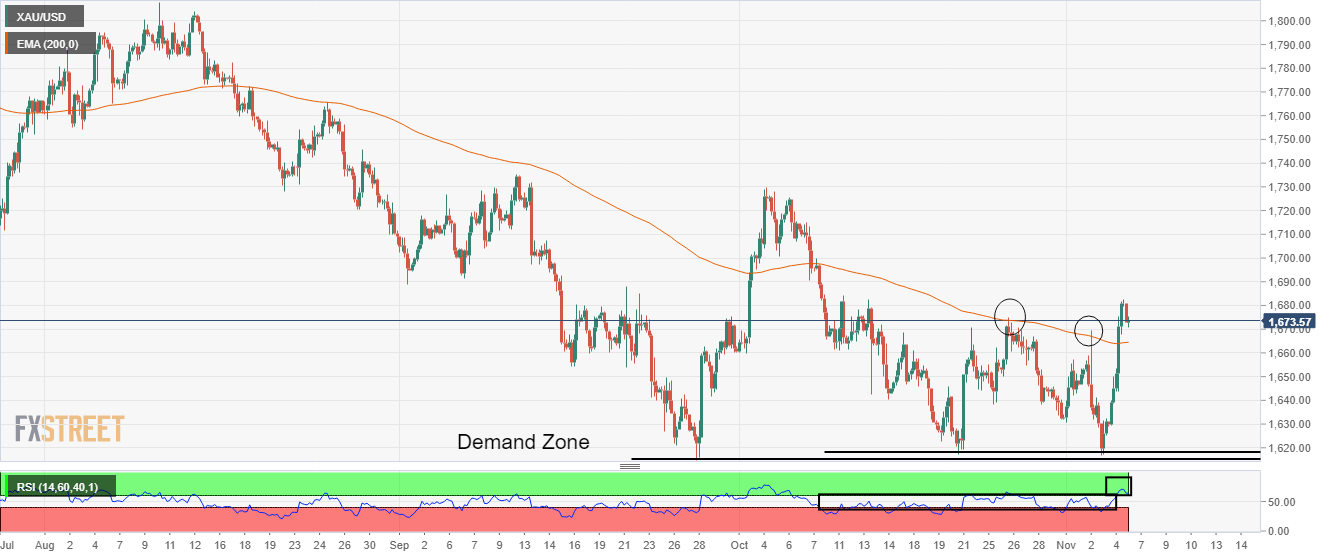
Gold technical analysis

Gold price has witnessed a stellar buying response after testing the demand zone placed in a narrow range of $1,615.70-1,618.64 on a four-hour scale. The 200-period Exponential Moving Average (EMA) at $1,664.20 acted as a barricade earlier but will not act as support ahead.

Meanwhile, the Relative Strength Index (RSI) (14) has shifted to the bullish range of 60.00-80.00, which indicates the upside momentum has been triggered.

Gold four-hour chart

XAU/USD

Overview
Today last price1672.46
Today Daily Change-8.56
Today Daily Change %-0.51
Today daily open1681.02
 
Trends
Daily SMA201651.98
Daily SMA501675.13
Daily SMA1001720.45
Daily SMA2001805.43
 
Levels
Previous Daily High1682.49
Previous Daily Low1628.8
Previous Weekly High1682.49
Previous Weekly Low1616.69
Previous Monthly High1729.58
Previous Monthly Low1617.35
Daily Fibonacci 38.2%1661.98
Daily Fibonacci 61.8%1649.31
Daily Pivot Point S11645.72
Daily Pivot Point S21610.41
Daily Pivot Point S31592.03
Daily Pivot Point R11699.41
Daily Pivot Point R21717.79
Daily Pivot Point R31753.1

Author

Sagar Dua

Sagar Dua

FXStreet

Sagar Dua is associated with the financial markets from his college days. Along with pursuing post-graduation in Commerce in 2014, he started his markets training with chart analysis.

More from Sagar Dua
Share:

Markets move fast. We move first.

Orange Juice Newsletter brings you expert driven insights - not headlines. Every day on your inbox.

By subscribing you agree to our Terms and conditions.

Editor's Picks

EUR/USD bears await break below 100-day SMA support near 1.1665 area

The EUR/USD pair attracts heavy selling for the second straight day and dives to a nearly four-week trough, around the 1.1670 region, during the Asian session on Monday. Bearish traders now await a sustained break below the 100-day Simple Moving Average before positioning for an extension of the recent pullback from a three-month top, or levels just above the 1.1800 mark touched on December 24.

GBP/USD falls toward 1.3400 near 50-day EMA

GBP/USD extends its losses for the second successive session, trading around 1.3420 during the Asian hours on Monday. The technical analysis of the daily chart indicates that the 14-day Relative Strength Index at 53 has eased from near overbought, indicating that momentum has cooled while remaining above the midline. RSI holds above 50, keeping a modest bullish bias.

Gold on fire at the start of the week on US-Venezuela tensions

Gold regains upside traction early Monday as flight to safety prevails on Venezuela turmoil. The US Dollar finds strong haven demand, caps Gold’s upside as focus shifts to US jobs data. Gold’s daily technical setup suggests that more upside remains in the offing.

Bulls firmly in control as Bitcoin breaks $93K, Ethereum and Ripple extend gains

Bitcoin, Ethereum, and Ripple extended their rallies on Monday, gaining more than 4%, 6%, and 12%, respectively, in the previous week. The top three cryptocurrencies by market capitalization could continue to outperform, with bulls in control of the momentum.

Economic outlook 2026-2027 in advanced countries: Solidity test

After a year marked by global economic resilience and ending on a note of optimism, 2026 looks promising and could be a year of solid economic performance. In our baseline scenario, we expect most of the supportive factors at work in 2025 to continue to play a role in 2026.

Meme Coins Price Prediction: Dogecoin, Shiba Inu, Pepe rally on Venezuela’s shadow BTC reserve

Meme coins such as Dogecoin, Shiba Inu, and Pepe are leading the cryptocurrency market rally driven by the US cross-border operation to capture Venezuelan President Nicolás Maduro. Dogecoin extends its gain for the fifth consecutive day while SHIB and PEPE take a pause.