Gold Price Forecast: XAUUSD could aim to reclaim $1,800 mark – Confluence Detector
- Gold climbs to its highest level since August 18 amid sustained USD selling bias.
- Bets for less aggressive Fed rate hikes, sliding US bond yields weigh on the buck.
- The risk-on mood might turn out to be the only factor capping gains for the metal.
- Some follow-through buying will set the stage for gains towards the $1,800 mark.

Gold builds on the previous day's post-US CPI breakout momentum beyond the 100-day SMA and gains some follow-through traction on Friday. The upward trajectory lifts the XAUUSD to its highest level since August 18, around the $1,766 region during the first half of the European session.
The softer US consumer inflation figures released on Thursday reaffirm bets for smaller rate hikes by the Federal Reserve. This, in turn, drags the US Dollar to a two-and-half-month low and acts as a tailwind for the dollar-denominated gold. Moreover, expectations for peak US interest rates dropped below 5%, which leads to a further decline in the US Treasury bond yields and offers additional support to the non-yielding yellow metal. That said, the prevalent risk-on mood might hold back bulls from placing aggressive bets and keep a lid on any further gains for the safe-haven XAUUSD.
Gold Price: Key levels to watch
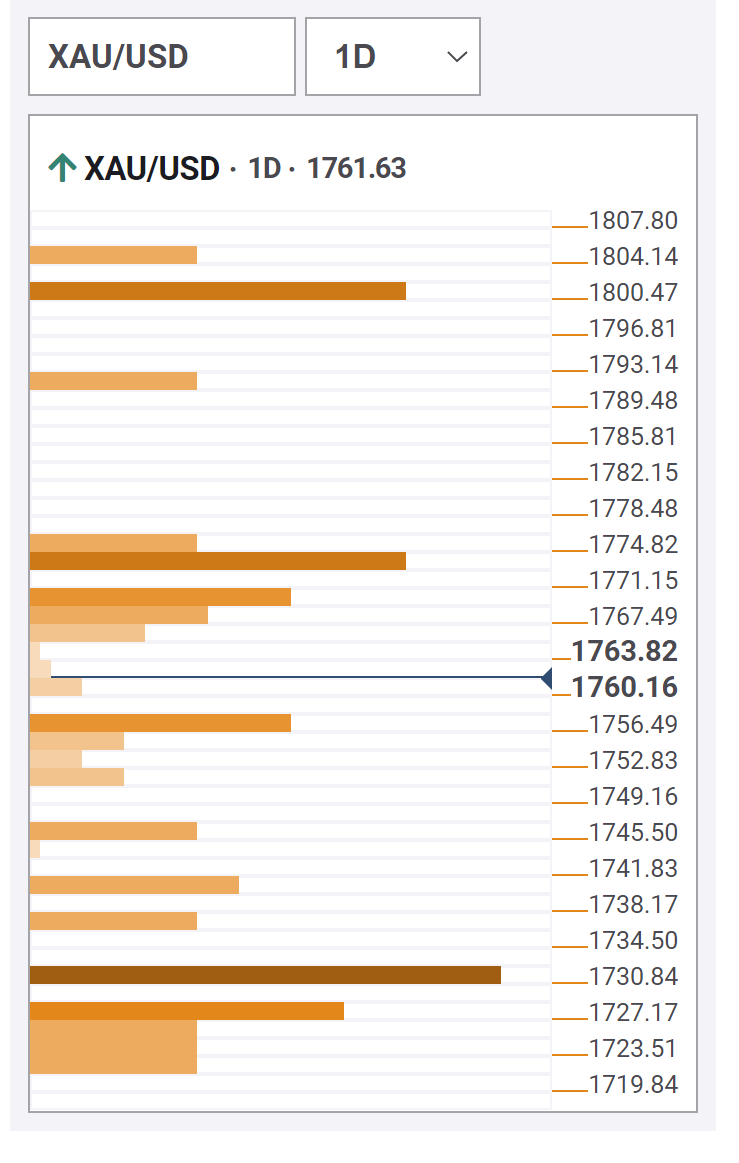
The Technical Confluence Detector shows that the next relevant hurdle for gold is pegged near the $1,770 area - Pivot Point 1-Week R3. This is closely followed by $1,773-$1,775 region - Pivot Point 1-Month R2 and Pivot Point 1-Day R1. Some follow-through buying will be seen as a fresh trigger for bullish traders and set the stage for a move towards the $1,790 level - Pivot Point 1-Day R2 - en route to the $1,800 psychological mark – Fibonacci 161.8% 1-Month.
On the flip side, the $1,757-$1,756 area - Previous High 1-Day - now seems to protect the immediate downside ahead of the $1,745 level - Fibonacci 23.6% 1-Day. A convincing break below might prompt some technical selling and accelerate the corrective slide, dragging gold to the $1,730 region - Previous Month High. The latter should act as a strong base for the XAUUSD, which if broken decisively could probably negate prospects for any further appreciating move.
Here is how it looks on the tool
About Technical Confluences Detector
The TCD (Technical Confluences Detector) is a tool to locate and point out those price levels where there is a congestion of indicators, moving averages, Fibonacci levels, Pivot Points, etc. If you are a short-term trader, you will find entry points for counter-trend strategies and hunt a few points at a time. If you are a medium-to-long-term trader, this tool will allow you to know in advance the price levels where a medium-to-long-term trend may stop and rest, where to unwind positions, or where to increase your position size.
Author

Haresh Menghani
FXStreet
Haresh Menghani is a detail-oriented professional with 10+ years of extensive experience in analysing the global financial markets.

















