|

Gold Price Forecast: XAU/USD turns volatile, a pullback looks likely

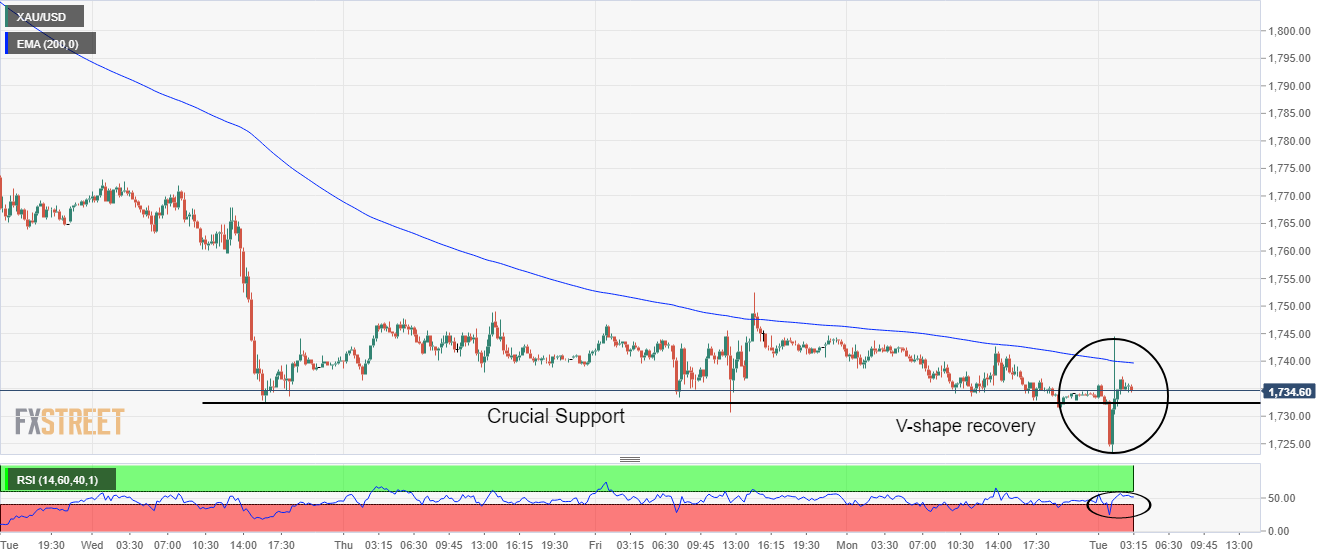
  • Gold price has displayed wild moves after surrendering the critical support of $1,732.27.
  • The DXY has not displayed reversal signs and aims higher ahead of US Inflation.
  • The US Retail Sales are seen meaningfully higher at 0.8% than the prior print of -0.3%.

Gold price (XAU/USD) is displaying wild swings in the Asian session. The precious metal has gyrated in a tad wider range of $1,723.27-1,744.34 in the last two hours of the trading session. No wonder, the volatile move could be a make or break for the asset. Considering the move more precisely, this seems to be a responsive buying action, which takes place when the market participants find the asset a value bet and has soaked entire offers without much effort.

Meanwhile, the US dollar index (DXY) has faced profit-booking after printing a fresh 19-year high at 108.47. The DXY has delivered a stellar performance on expectations of a higher release of the inflation rate. A preliminary estimate for the US Consumer Price Index (CPI) is 8.8%, higher than the prior release of 8.6%. A higher than or within expectation release of the inflation rate will compel the Federal Reserve (Fed) to tighten its policy further and raise interest rates to 2.25-2.50%.

Apart from the US Inflation, US Retail Sales also hold significant importance, which will release on Friday. The economic data is seen meaningfully higher at 0.8% than the prior print of -0.3%.

Gold technical analysis

On an intraday scale, the gold prices have witnessed a V-shape recovery after hitting a low of. This V-shape recovery indicates a responsive buying action and is followed by a pullback move. The precious metal has reclaimed the crucial support placed from the previous week’s low at $1,732.27.  The bright metal has also attacked the 200-EMA at $1,740.00, however, it failed to sustain above the same. Meanwhile, the Relative Strength Index (RSI) (14) has returned to the 40.00-60.00 range.

Gold intraday chart
XAU/USD

Overview
Today last price1734.62
Today Daily Change0.56
Today Daily Change %0.03
Today daily open1734.06
 
Trends
Daily SMA201805.09
Daily SMA501831.16
Daily SMA1001884.29
Daily SMA2001845.7
 
Levels
Previous Daily High1744.73
Previous Daily Low1731.33
Previous Weekly High1814.37
Previous Weekly Low1730.73
Previous Monthly High1879.26
Previous Monthly Low1802.79
Daily Fibonacci 38.2%1736.45
Daily Fibonacci 61.8%1739.61
Daily Pivot Point S11728.68
Daily Pivot Point S21723.31
Daily Pivot Point S31715.28
Daily Pivot Point R11742.08
Daily Pivot Point R21750.11
Daily Pivot Point R31755.48

Author

Sagar Dua

Sagar Dua

FXStreet

Sagar Dua is associated with the financial markets from his college days. Along with pursuing post-graduation in Commerce in 2014, he started his markets training with chart analysis.


More from Sagar Dua
Share:

Editor's Picks

AUD/USD shows resilience below 38.2% Fibo. near mid-0.7100s

The AUD/USD pair touches a one-and-a-half-week low, around the 0.7140 region during the Asian session on Monday, though it lacks follow-through. Spot prices currently trade just above mid-0.7100s, down nearly 0.25% for the day.


USD/JPY: Japanese Yen edges lower vs USD amid Middle East jitters as Fed, BoJ meetings loom

The USD/JPY pair attracts some buyers at the start of a new week and climbs closer to the 154.00 mark during the Asian session, reversing a part of Friday's losses. Spot prices, however, remain confined in a range held over the past week or so and within striking distance of a nearly seven-month low, touched last Tuesday, as traders await this week's key central bank events.


Gold: Fed’s rate decision to drive the next move
Gold reflects a subdued performance at the start of the Federal Reserve’s (Fed) monetary policy week at around $4,330. Fed’s interest rate expectations heavily influenced last week after the release of the hot United States (US) Producer Price Index (PPI) and Consumer Price Index (CPI) reports for August.
Bitcoin consolidates, Ethereum faces hurdle, XRP nears key support
Bitcoin (BTC), Ethereum (ETH) and Ripple (XRP) start the week near crucial technical levels after a broadly bearish performance, correcting over 4%, 1.5% and 5% last week. BTC consolidates around $77,600, while ETH approaches key $2,550 resistance. Meanwhile, XRP trades near its key level around $1.354, making this support level crucial for its near-term outlook.
US Dollar Weekly Forecast: The last line of defense

There was no respite to the downward trend for the US Dollar this week, which added to the prior week’s retracement and at some point flirted with the area of four-month lows. Indeed, after trading at levels just shy of its psychological 100.00 barrier early in the month, the US Dollar Index has come all the way down to challenge the 98.50 zone, extending its negative streak for the third month in a row.

Venezuela’s 65-billion-barrel Oil deal could reshape America’s inflation fight
The United States (US) has secured unprecedented access to part of Venezuela’s vast Oil reserves. The timing is particularly significant as the war with Iran is disrupting Middle Eastern supplies, keeping energy prices elevated and reviving concerns about inflation.














