|

Gold Price Forecast: XAU/USD struggles around $1,760 as Fed’s rate slowdown poses a double-edged sword

  • Gold price is facing hurdles while surpassing the immediate hurdle of $1,760.00.
  • Investors see Fed’s rate hike slowdown as a double-edged sword as core CPI has not shown a meaningful slowdown yet.
  • An improvement in US Durable Goods Orders poses a bullish filter for the core CPI data.

Gold price (XAU/USD) is facing barricades around the critical resistance of $1,760.00 in the early European session. The precious metal has refreshed its weekly high at $1,761.05, however, further upside seems capped despite a risk-on tone in the global markets.

The USD Index (DXY) is auctioning around its weekly support at 105.65 amid a sheer decline in safe-haven’s appeal. Meanwhile, S&P500 futures are behaving like a dead cat amid the holiday mood in the United States on account of Thanksgiving Day.

No doubt, the headline inflation numbers in the US economy have displayed signs of a decline, however, the core CPI numbers have not shown meaningful signs of slippage yet. Also, the US Durable Goods Orders data that was released this week showed improvement, which is a sign of acceleration in core inflation ahead.

Federal Reserve (Fed) policymakers are required to take significant precautions before making a strategic plan for December monetary policy meeting as a decision to a slowdown in the interest rate hike could be a double-edged sword for them.

Gold technical analysis

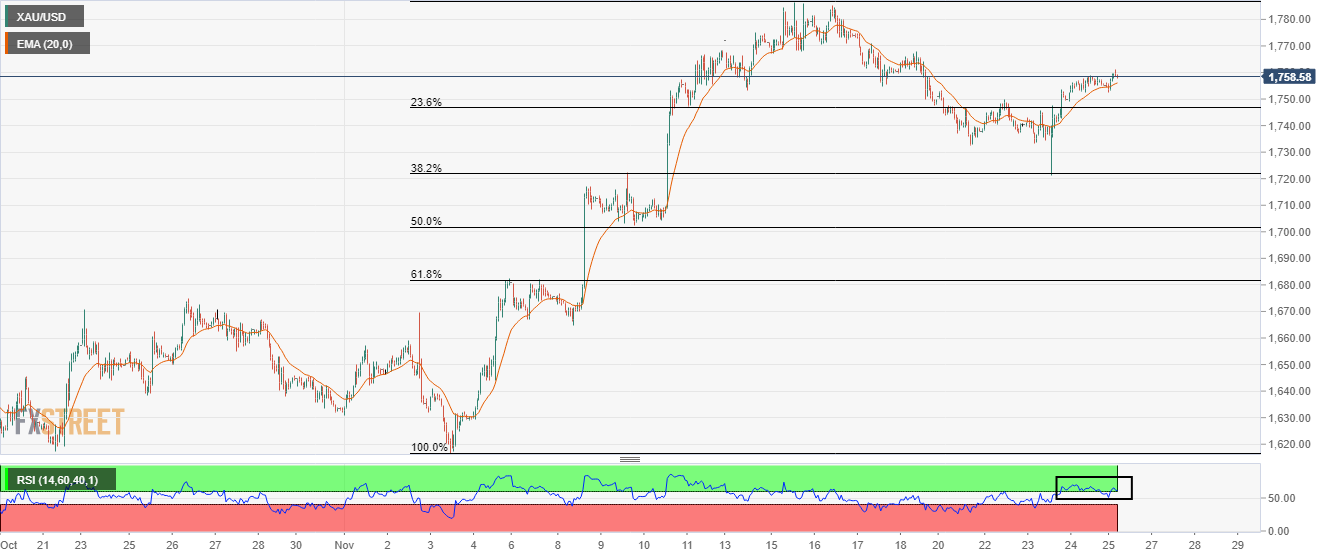
On an hourly scale, Gold price has displayed a steep recovery after testing the 38.2% Fibonacci retracement (plotted from November 3 low at $1,616.69 to November 15 high at $1,758.88) at $1,722.00. The precious metal has extended its recovery after testing the 20-period Exponential Moving Average (EMA) at $1,754.65.

Meanwhile, the Relative Strength Index (RSI) (14) has reclaimed the bullish range of 60.00-80.00, which indicates more upside ahead.

Gold hourly chart

XAU/USD

Overview
Today last price1758.03
Today Daily Change2.98
Today Daily Change %0.17
Today daily open1755.05
 
Trends
Daily SMA201715.38
Daily SMA501685.27
Daily SMA1001711.94
Daily SMA2001799.71
 
Levels
Previous Daily High1758.68
Previous Daily Low1749.26
Previous Weekly High1786.55
Previous Weekly Low1747.6
Previous Monthly High1729.58
Previous Monthly Low1617.35
Daily Fibonacci 38.2%1755.08
Daily Fibonacci 61.8%1752.86
Daily Pivot Point S11749.98
Daily Pivot Point S21744.91
Daily Pivot Point S31740.56
Daily Pivot Point R11759.4
Daily Pivot Point R21763.75
Daily Pivot Point R31768.82

Author

Sagar Dua

Sagar Dua

FXStreet

Sagar Dua is associated with the financial markets from his college days. Along with pursuing post-graduation in Commerce in 2014, he started his markets training with chart analysis.

More from Sagar Dua
Share:

Editor's Picks

EUR/USD seems fragile below 1.1700 as Middle East war boosts energy prices

The EUR/USD pair trades flat at around 1.1680 during the Asian trading session on Tuesday, but broadly seems vulnerable, being close to its five-week low. The major currency pair is under pressure as surging oil prices due to the United States-Israel war with Iran have increased the risks of higher inflation for the Old Continent.

GBP/USD hovers around 1.3400 with bearish pressure intact

GBP/USD edges higher after three days of losses, trading around 1.3400 during the Asian hours on Tuesday. The technical analysis of the daily chart indicates an ongoing bearish bias, as the pair trades within a descending channel pattern.

Gold sticks to gains above $5,350 amid sustained safe-haven demand; firmer USD caps gains

Gold sticks to its positive bias for the third straight day and trades above the $5,350 level heading into the European session on Tuesday. Concerns about a broader regional conflict in the Middle East continue to weigh on investors' sentiment and underpin demand for the traditional safe-haven bullion.

Stellar risks deeper losses as derivatives metrics turn negative

Stellar is trading red below $0.16 at the time of writing on Tuesday, after a slight recovery the previous day. Weakening derivatives data caps the recovery, while an unfavorable technical outlook projects a deeper correction for the XLM token in the upcoming days.

The market is not panicking it is repricing the probability distribution of Oil and time

At the end of the day, markets do not trade morality or geopolitics. They trade transmission channels. And the only channel that truly matters in this maelstrom runs through the price of energy and the time value of money.

Grass 20% bullish breakout defies broader market weakness

Grass (GRASS) is edging up above $0.30 at the time of writing on Monday. The token’s notable 20% intraday surge stands out amid heightened volatility in the broader crypto market.