|

Gold Price Forecast: XAU/USD senses hurdles around $1,930 as market mood sours, yields extend gains

  • Gold price has sensed selling interest around $1,930.00 as a risk-off profile has emerged.
  • Rising yields on US Treasuries have provided a cushion to the US Dollar Index.
  • US firms are hoping for a bleak economic outlook amid rising interest rates by the Fed.

Gold price (XAU/USD) has sensed barricades while attempting to cross the critical resistance of $1,930.00 in the Asian session. The precious metal has witnessed selling interest as investors are turning risk averse in the interest rate policy week. The Federal Reserve (Fed) is set to announce its first interest rate decision of CY2023 on Wednesday.

S&P500 futures show losses in the Asian session, expressing escalating caution in the market sentiment. The US Dollar Index (DXY) has recovered sharply after a correction to near 101.50. A recovery in the USD index is supported by rising returns on US Treasury bonds. The 10-year US Treasury yields have climbed to near 3.53%.

In addition to the Fed’s monetary policy, investors will keep an eye on the United States Automatic Data Processing (ADP) Employment data, which is expected to drop vigorously to 86K vs. the former release of 235K. Rising interest rates by Fed chair Jerome Powell to tame the Consumer Price Index (CPI) has trimmed the overall demand, which has squeezed labor demand by firms amid a bleak economic outlook.

Gold technical analysis

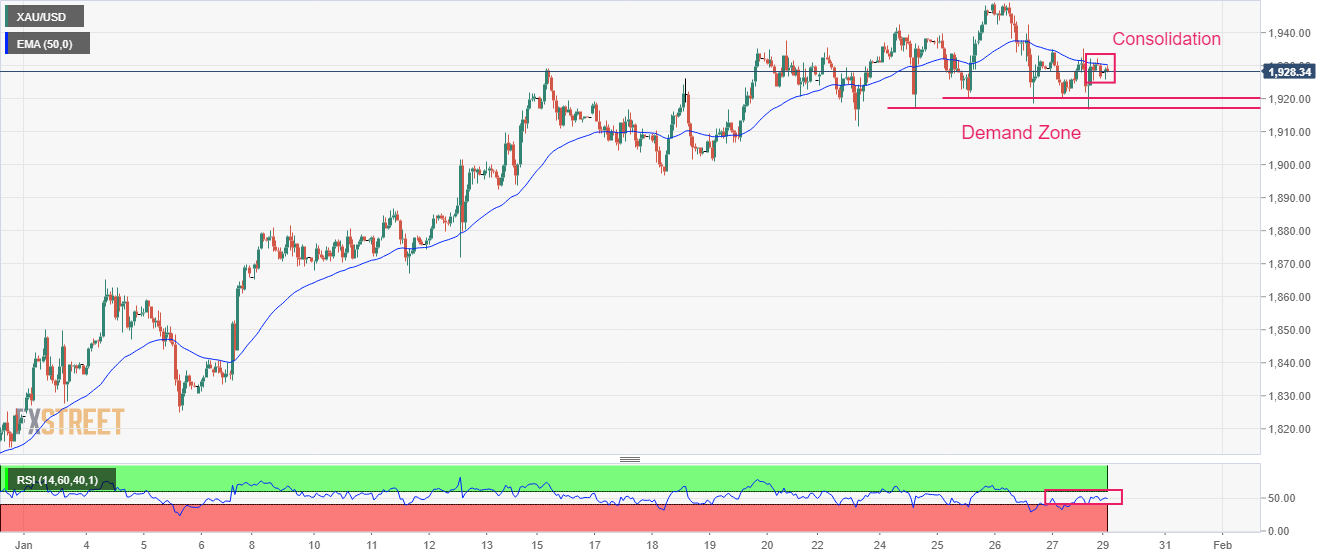
Gold price is juggling in a small range bounded consolidation on an hourly scale that indicates volatility contraction. The 50-period Exponential Moving Average (EMA) at $1,930.00 had been a significant barricade for the Gold bulls. The demand zone in a $1,917-1,920 range will support the asset ahead.

The Relative Strength Index (RSI) (14) oscillates in a 40.00-60.00 range, indicating that investors are awaiting a fresh trigger for a power-pack action.

Gold hourly chart
XAU/USD

Overview
Today last price1926.88
Today Daily Change0.20
Today Daily Change %0.01
Today daily open1926.68
 
Trends
Daily SMA201896.14
Daily SMA501829.25
Daily SMA1001755.29
Daily SMA2001775.48
 
Levels
Previous Daily High1935.1
Previous Daily Low1916.73
Previous Weekly High1949.27
Previous Weekly Low1911.45
Previous Monthly High1833.38
Previous Monthly Low1765.89
Daily Fibonacci 38.2%1923.75
Daily Fibonacci 61.8%1928.08
Daily Pivot Point S11917.24
Daily Pivot Point S21907.8
Daily Pivot Point S31898.87
Daily Pivot Point R11935.61
Daily Pivot Point R21944.54
Daily Pivot Point R31953.98

Author

Sagar Dua

Sagar Dua

FXStreet

Sagar Dua is associated with the financial markets from his college days. Along with pursuing post-graduation in Commerce in 2014, he started his markets training with chart analysis.


More from Sagar Dua
Share:

Editor's Picks

AUD/USD holds firm near 0.7000 after Chinese inflation, trade data

AUD/USD stays firm near 0.7000 in Wednesday’s Asian session, picking up some bids after China's mixed inflation and upbeat trade data. CPI rose less than expected in September, while PPI inflation picked up. Meanwhile, the Chinese trade surplus unexpectedly widened in September. The pair remains underpinned by a broadly subdued US Dollar, despite the Middle East escalation, as focus remains on US CPI data.

USD/JPY consolidates near 158.50; looks to US CPI for fresh impetus

USD/JPY stays range-bound near 158.50 in the Asian session on Wednesday, with looming intervention risks supporting the Japanese Yen and capping upside amid a softer US Dollar. However, geopolitical uncertainties act as a tailwind for the safe-haven USD and the pair. Traders also seem hesitant ahead of the release of the latest US inflation figures.

Gold looks to $4100 and US CPI inflation amid geopolitical risks

Gold falls for the third straight day on Wednesday, as the recent recovery falters ahead of US inflation. US Dollar pauses correction amid rising Oil prices and stabilizing US Treasury bond yields. The daily bearish RSI remains a headwind for Gold buyers, with $4,100 seen at risk.

Strategy bitcoin buying model faces scrutiny as STRC costs climb
Strategy’s (MSTR) STRC financing strategy increased its Bitcoin (BTC) holdings in H1, but made its capital structure more expensive, prompting an examination of its effectiveness, according to a Tuesday report by K33. STRC recovered close to its $100 par value, closing at $99.90 after an extended period of heavy buybacks.
What happens after a US Treasury market crash
The global bond market is under severe pressure as US Treasury yields reach multi-decade highs, driven by persistent inflation risk, heavy government and corporate debt issuance, and expanding term premiums. Higher yields raise borrowing costs and tighten financial conditions, but a severe bond selloff can ultimately shift investor focus from inflation to growth and financial stability.
Has Bitcoin really escaped the macro forces it was built to fight?
Over 17 years ago, Satoshi Nakamoto designed Bitcoin (BTC) on the back of a global financial crisis as an alternative to the global monetary system outside the control of central banks, governments and traditional intermediaries. This raises a key question: has Bitcoin really become independent of the macroeconomic forces it was built to challenge?















