Gold Price Forecast: XAU/USD retreats towards $1,650 ahead of US GDP, focus on yields
- Gold price fades bounce off yearly low, pares the biggest daily jump since early March.
- XAU/USD buyers returned as yields slumped the most in six months, DXY printed biggest daily fall since March 2020.
- BOE, ECB managed to trigger DXY’s corrective pullback.
- Challenges to risk, hawkish Fedspeak keeps gold sellers hopeful, softer US GDP could help extend metal’s recovery.

Gold price (XAU/USD) retreats to $1,658, after posting the biggest daily jump in six months to recover from the two-year low, as buyers reassess the bullish move considering the presence of the risk-negative catalysts. That said, the metal’s hesitance in extending the latest rise could also be linked to the cautious mood ahead of final readings of the US Q2 Gross Domestic Product (GDP).
The quote began Wednesday on the back foot and refreshed the two-year low as the US dollar cheered the market’s rush for risk safety. However, the Bank of England’s (BOE) bond-buying plan to restore market confidence joined hawkish comments from the European Central Bank (ECB) policymakers to weigh on the US dollar and trigger the yields’ slump, which in turn pleased the XAU/USD bulls afterward.
That said, the Bank of England (BOE) announced a bond-buying program to defend the British Pound (GBP) on Wednesday. The details suggest that the BOE will buy bonds with a maturity of over 20 years and up to 5 billion sterling worth per auction initially. On the other hand, ECB President Christine Lagarde reiterated on Wednesday that they will continue to raise rates in the next several meetings, as reported by Reuters. There were several other ECB Governing Council members namely Olli Rehn, Peter Kazimir, and Robert Holzmann who openly favored a 0.75% rate hike in the next meeting.
Elsewhere, the US international trade deficit narrowed by $2.9 billion to $87.3 billion in August from $90.2 billion in July. Details suggest that the Exports dropped for the first time since January while Imports marked the fifth consecutive monthly decline. Further, Atlanta Fed President Raphael Bostic said on Wednesday that the baseline scenario right now includes a 75 basis points (bps) rate hike in November and a 50 bps increase in December, as reported by Reuters. Additionally, Chicago Federal Reserve President Charles Evans also emphasized the need to address inflation and tried to renew the US dollar buying but could not due to the softer yields.
That said, the US 10-year Treasury bond yields slumped the most in six months and allowed equities to consolidate recent losses, which in turn dragged the US Dollar Index (DXY) from the multi-year high.
It’s worth noting, however, that the market’s doubts over the BOE-led optimism and the fears of the European energy crisis could join the hawkish Fedspeak to renew the gold’s selling if today’s US GDP data offer a positive surprise.
Technical analysis
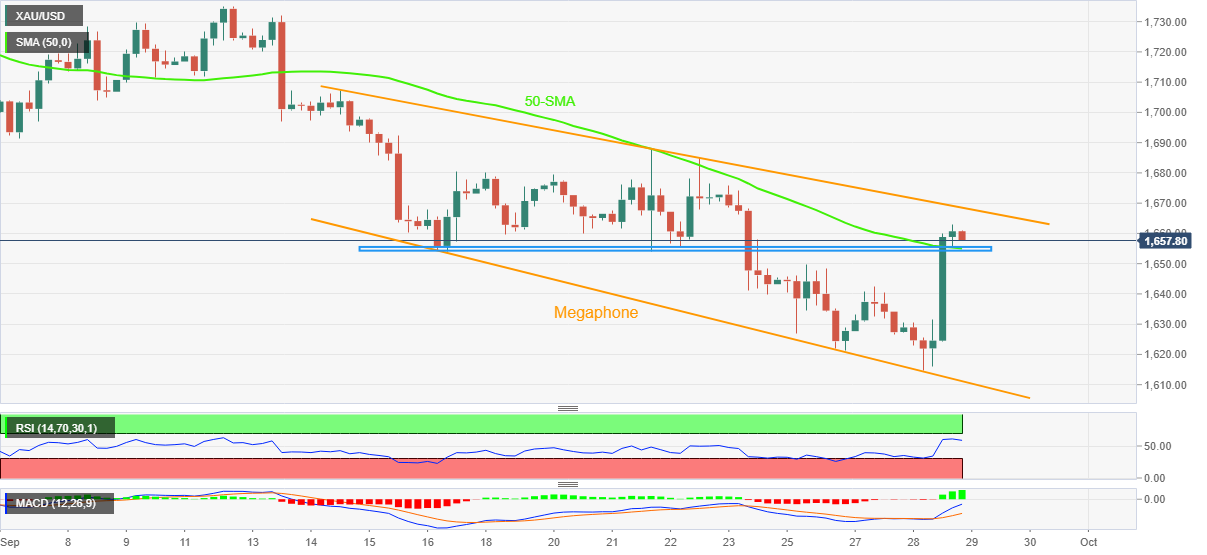
Gold price remains sidelined inside a short-term trend-widening bearish megaphone chart pattern.
The quote’s latest break of the $1,654-55 resistance confluence including the 50-SMA and a fortnight-old horizontal area, now support, directs XAU/USD buyers towards the stated formation’s upper line, at $1,669 by the press time.
It should, however, be noted that the bullish MACD signals and the RSI run-up is teasing the buyers and hence a clear upside break of the $1,669, also crossing the $1,670 hurdle, won’t hesitate to direct the bulls towards the previous weekly top surrounding $1,690.
Meanwhile, a downside break of $1,655-54 resistance-turned-support could quickly direct the gold bears towards $1,640 and the latest low near $1,615. Though, the support line of the aforementioned megaphone, close to $1,611, appears a tough nut to crack for the sellers afterward.
Gold: Four-hour chart
Trend: Limited upside expected
Author

Anil Panchal
FXStreet
Anil Panchal has nearly 15 years of experience in tracking financial markets. With a keen interest in macroeconomics, Anil aptly tracks global news/updates and stays well-informed about the global financial moves and their implications.
















