Gold Price Forecast: XAU/USD remains choppy around $1,960 despite US Dollar extending losses
- Gold price is trading back-and-forth around $1,960.00 as investors await further triggers.
- As the second-quarter result season is on its way, sheer volatility in US equities cannot be ruled out.
- Gold price has delivered a breakout of the Wyckoff ‘Accumulation’ chart pattern.

Gold price (XAU/USD) is demonstrating a non-directional performance around $1,960.00 as investors are awaiting United States Producer Price Index (PPI) data for further guidance. The US Dollar Index (DXY) is struggling to find any intermediate support as investors are hoping that the Federal Reserve (Fed) could tweak its old commentary of ‘two more rate hikes are appropriate’ after June’s soft inflation report.
S&P500 futures have generated significant gains in the European session, portraying the strong risk appetite of the market participants. As the second-quarter result season is on its way, sheer volatility in US equities cannot be ruled out. The yields offered on 10-year US Treasury bonds have rebounded to near 3.83%.
After soft inflation report, investors have shifted their focus towards the US PPI data, which will release at 12:30 GMT. As per the consensus, monthly headline and core PPI are expected to show a pace of 0.2%. Annual headline PPI is likely to decelerate to 0.4% vs. the former release of 1.1%. Sheer softening of prices of goods and services at factory gates would cool down inflationary pressures. Also, a decline in PPI would convey that the overall demand is in a declining stage.
Minneapolis Fed Bank President Neel Kashkari cited that policy rates needed to raise further and supervisors must ensure that banks are prepared to run new high-inflation stress tests to identify at-risk banks and size individual capital shortfalls.", as reported by Reuters.
Gold technical analysis
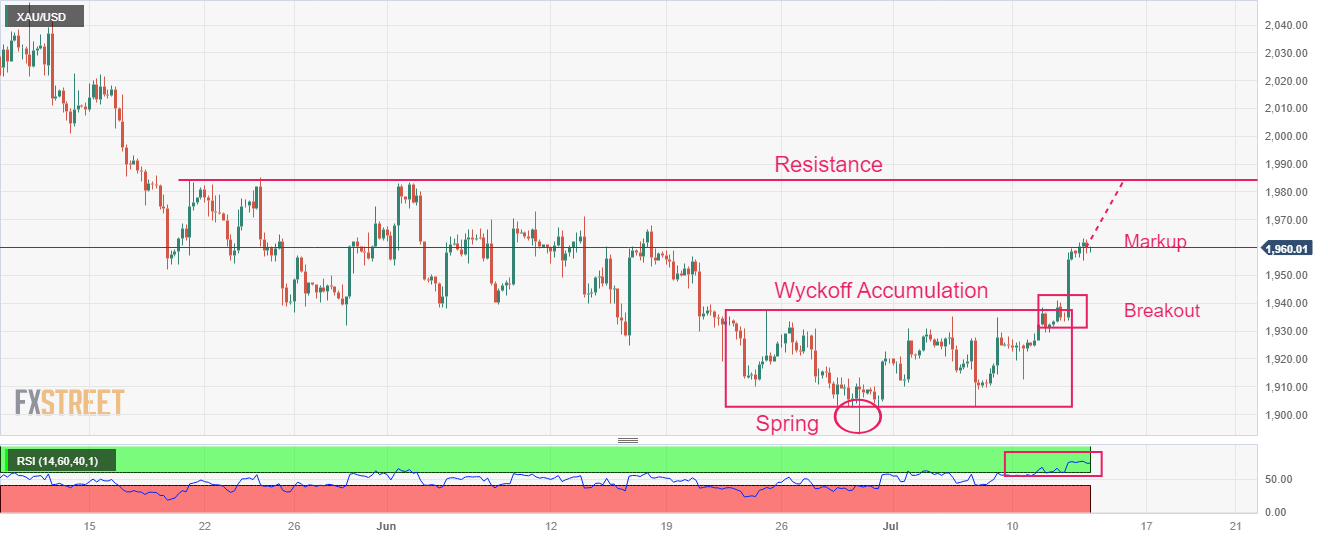
Gold price has delivered a breakout of the Wyckoff ‘Accumulation’ formed on a four-hour scale in which inventory is transferred from retail participants to institutional investors. The precious metal is in a ‘mark up’ phase and is expected to find stoppage near the horizontal resistance plotted from May 19 high at $1,984.25.
The Relative Strength Index (RSI) (14) has shifted into the bullish range of 60.00-80.00, indicating strength in the upside momentum.
Gold four-hour chart
Author

Sagar Dua
FXStreet
Sagar Dua is associated with the financial markets from his college days. Along with pursuing post-graduation in Commerce in 2014, he started his markets training with chart analysis.


