Gold Price Forecast: XAU/USD rebounds inside weekly bearish channel, Covid, Treasury yields in focus


  • Gold price picks up bids to snap four-day downtrend inside bearish chart pattern.
  • US Dollar traces downbeat Treasury yields after mixed Fedspeak, softer US data.
  • China’s daily Covid cases jump to seven-month high, chatters over Beijing’s XAU/USD buying also underpin recovery.

Gold price (XAU/USD) prints the first daily gains in four around $1,745 during early Tuesday morning. In doing so, the bright metal cheers the broad US Dollar retreat amid a likely sluggish day ahead of the key data/events scheduled for publishing on Wednesday.

That said, the US Dollar Index (DXY) drops to 107.55, down 0.25% intraday while snapping a three-day uptrend. The greenback’s gauge traces the US Treasury yields amid recent challenges to the hawkish concerns surrounding the US Federal Reserve (Fed).

The US 10-year Treasury yields print the first daily loss in four, down one basis point near 3.81% by the press time, as the latest comments from the Federal Reserve (Fed) officials fail to bolster the previously hawkish bias.

It should be noted that Federal Reserve Bank of Cleveland President Loretta Mester said in a CNBC interview, “I think we can slow down from 75 at the December meeting.” Previously, Atlanta Federal Reserve President Raphael Bostic also turned down the 75 bps move and challenged the DXY bulls. Additionally, downbeat prints of the Chicago Fed National Activity Index for October, to -0.05 compared to 0.17 prior, also challenged the US Dollar bulls.

On the other hand, seven-month high daily coronavirus cases from China renewed supply-crunch fears and keeps the US Dollar buyers hopeful ahead of tomorrow’s preliminary readings of the monthly activity data and the Federal Open Market Committee (FOMC) Meeting Minutes.

Additionally keeping the Gold buyers hopeful are the latest headlines from Nikkei Asia suggesting that China is likely stockpiling the metal while unloading the US Treasury bonds.

Also read: China thought to be stockpiling Gold to cut greenback dependence – Nikkei

Amid these plays, the S&P 500 Futures print mild gains whereas the stocks in the Asia-Pacific region trade mixed by the press time.

Looking forward, risk catalysts will be important to determine the intraday XAU/USD moves amid a light calendar for the day. That said, headlines surrounding China’s Covid conditions and expectations of the Fed’s next moves, as well as the US Treasury bond yields, will be crucial for clear directions.

Technical analysis

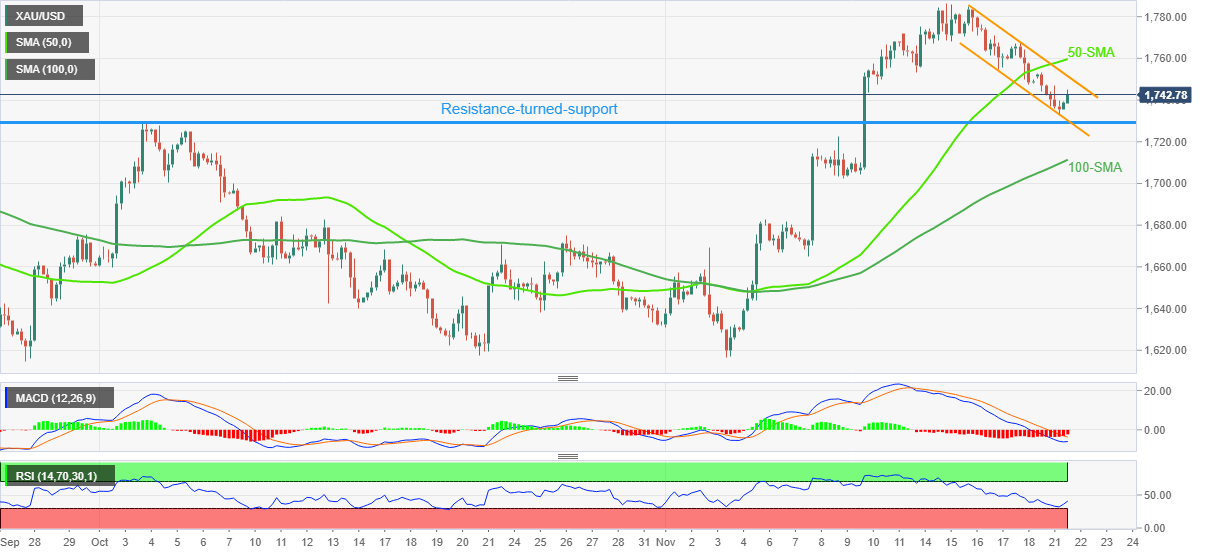
Gold price portrays a one-week-old bearish channel below the 50-SMA to keep the XAU/USD sellers hopeful. Also supporting the downside bias are the bearish MACD signals.

However, the RSI (14) rebound from the oversold territory underpins the recovery moves that challenge the bearish chart pattern, by approaching the stated channel’s resistance line surrounding $1,752.

That said, the XAU/USD run-up beyond $1,752 will need validation from the 50-SMA hurdle of $1,760 to convince the Gold buyers in challenging the monthly top surrounding $1,786.

On the flip side, a convergence of the previous resistance line from early October and the lower line of the aforementioned bearish channel highlights the $1,730 as the key support for sellers to conquer before retaking control.

Also acting as a downside filter is the 100-SMA support near $1,710 and the $1,700 threshold.

Gold price: Daily chart

Trend: Limited recovery expected

Additional important levels

Overview
Today last price 1743.45
Today Daily Change 4.24
Today Daily Change % 0.24%
Today daily open 1739.21
 
Trends
Daily SMA20 1702.09
Daily SMA50 1681.62
Daily SMA100 1711.91
Daily SMA200 1801.46
 
Levels
Previous Daily High 1753.06
Previous Daily Low 1732.61
Previous Weekly High 1786.55
Previous Weekly Low 1747.6
Previous Monthly High 1729.58
Previous Monthly Low 1617.35
Daily Fibonacci 38.2% 1740.42
Daily Fibonacci 61.8% 1745.25
Daily Pivot Point S1 1730.19
Daily Pivot Point S2 1721.18
Daily Pivot Point S3 1709.74
Daily Pivot Point R1 1750.64
Daily Pivot Point R2 1762.08
Daily Pivot Point R3 1771.09


Share: Feed news

Information on these pages contains forward-looking statements that involve risks and uncertainties. Markets and instruments profiled on this page are for informational purposes only and should not in any way come across as a recommendation to buy or sell in these assets. You should do your own thorough research before making any investment decisions. FXStreet does not in any way guarantee that this information is free from mistakes, errors, or material misstatements. It also does not guarantee that this information is of a timely nature. Investing in Open Markets involves a great deal of risk, including the loss of all or a portion of your investment, as well as emotional distress. All risks, losses and costs associated with investing, including total loss of principal, are your responsibility. The views and opinions expressed in this article are those of the authors and do not necessarily reflect the official policy or position of FXStreet nor its advertisers. The author will not be held responsible for information that is found at the end of links posted on this page.

If not otherwise explicitly mentioned in the body of the article, at the time of writing, the author has no position in any stock mentioned in this article and no business relationship with any company mentioned. The author has not received compensation for writing this article, other than from FXStreet.

FXStreet and the author do not provide personalized recommendations. The author makes no representations as to the accuracy, completeness, or suitability of this information. FXStreet and the author will not be liable for any errors, omissions or any losses, injuries or damages arising from this information and its display or use. Errors and omissions excepted.

The author and FXStreet are not registered investment advisors and nothing in this article is intended to be investment advice.

Recommended content


Recommended content

Editors’ Picks

EUR/USD holds below 1.0750 ahead of key US data

EUR/USD holds below 1.0750 ahead of key US data

EUR/USD trades in a tight range below 1.0750 in the European session on Friday. The US Dollar struggles to gather strength ahead of key PCE Price Index data, the Fed's preferred gauge of inflation, and helps the pair hold its ground. 

EUR/USD News

USD/JPY stays firm above 156.00 after BoJ Governor Ueda's comments

USD/JPY stays firm above 156.00 after BoJ Governor Ueda's comments

USD/JPY stays firm above 156.00 after surging above this level on the Bank of Japan's decision to leave the policy settings unchanged. BoJ Governor said weak Yen was not impacting prices but added that they will watch FX developments closely.

USD/JPY News

Gold price oscillates in a range as the focus remains glued to the US PCE Price Index

Gold price oscillates in a range as the focus remains glued to the US PCE Price Index

Gold price struggles to attract any meaningful buyers amid the emergence of fresh USD buying. Bets that the Fed will keep rates higher for longer amid sticky inflation help revive the USD demand.

Gold News

Bitcoin Weekly Forecast: BTC’s next breakout could propel it to $80,000 Premium

Bitcoin Weekly Forecast: BTC’s next breakout could propel it to $80,000

Bitcoin’s recent price consolidation could be nearing its end as technical indicators and on-chain metrics suggest a potential upward breakout. However, this move would not be straightforward and could punish impatient investors. 

Read more

US core PCE inflation set to signal firm price pressures as markets delay Federal Reserve rate cut bets

US core PCE inflation set to signal firm price pressures as markets delay Federal Reserve rate cut bets

The core PCE Price Index, which excludes volatile food and energy prices, is seen as the more influential measure of inflation in terms of Fed positioning. The index is forecast to rise 0.3% on a monthly basis in March, matching February’s increase. 

Read more

Forex MAJORS

Cryptocurrencies

Signatures