Gold Price Forecast: XAU/USD needs acceptance above $1795 to retake $1800 and beyond – Confluence Detector
- Gold makes another towards $1800 as the US dollar meets fresh supply.
- Investors reassess Friday’s US NFP report amid holiday-thinned trading.
- Gold Weekly Forecast: XAU/USD fails to clear key resistance at $1,790

Gold price catches a fresh bid and retests the two-week highs at $1795 on Monday, drawing support from the renewed weakness in the US dollar across the board. The greenback resumes its post-NFP downside after a brief rebound earlier on, in response to weaker Chinese Caixin Services PMI and persisting Delta covid strain worries. However, the dollar’s recovery appears to have faltered amid holiday-thinned market conditions while investors reassess the odds of the Fed’s hawkish policy action after the US payrolls outpaced expectations by 150K last month, with the Unemployment ticking higher to 5.9%.
Gold bulls need a decisive break above the $1795 supply zone to flex their muscles above $1800 and beyond. The US ISM Services PMI and FOMC minutes remain in focus, as a new week kicks off.
Read: Gold eyes further upside above $1795-$1797 region, focus shifts to Fed minutes
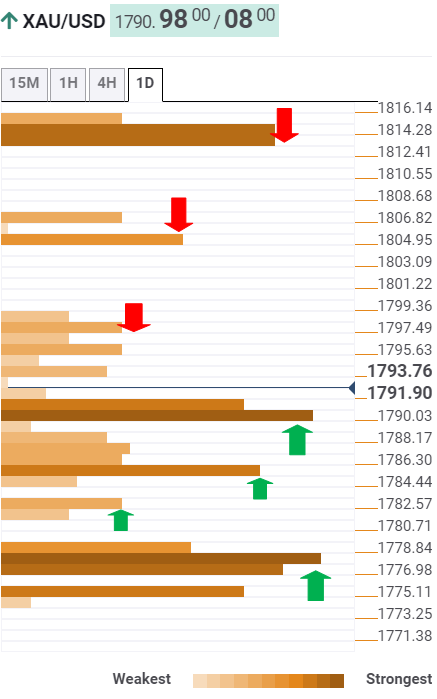
Gold Price: Key levels to watch
The Technical Confluences Detector shows that gold price is gathering strength to take Friday’s high of $1795, above which the confluence of the SMA100 four-hour and pivot point one-day R1 at $1797 will challenge the bullish commitments en-route $1800.
Acceptance above $1800 could trigger a quick advance towards the pivot point one-week R, which is aligned at $1805.
The next powerful upside barrier for gold price awaits at $1813, the Fibonacci 38.2% one-month.
Meanwhile, a failure to sustain above Friday’s high could reinforce bearish sentiment, opening floors towards strong resistance-turned-support at $1789, where the SMA100 one-day coincides with the Fibonacci 23.6% one-day and one-month.
Sellers will then target $1785, which is the convergence of the previous low four-hour and Fibonacci 23.6% one-week.
The Fibonacci 61.8% support at $1782 could then come into play.
The line in the sand for gold bulls is seen around $1776, which is a dense cluster of healthy support levels comprising of SMA10 one-day, SMA50 four-hour and Fibonacci 38.2% one-week.
Here is how it looks on the tool
About Technical Confluences Detector
The TCD (Technical Confluences Detector) is a tool to locate and point out those price levels where there is a congestion of indicators, moving averages, Fibonacci levels, Pivot Points, etc. If you are a short-term trader, you will find entry points for counter-trend strategies and hunt a few points at a time. If you are a medium-to-long-term trader, this tool will allow you to know in advance the price levels where a medium-to-long-term trend may stop and rest, where to unwind positions, or where to increase your position size.
Author

Dhwani Mehta
FXStreet
Residing in Mumbai (India), Dhwani is a Senior Analyst and Manager of the Asian session at FXStreet. She has over 10 years of experience in analyzing and covering the global financial markets, with specialization in Forex and commodities markets.