Gold Price Forecast: XAU/USD eyes further upside above $1795-$1797 region, focus shifts to Fed minutes
- Gold price takes a breather after the recent rally, as focus shifts to Fed minutes.
- Investors reassess Fed’s hawkish moves after Friday’s US NFP beat.
- The four-hourly chart shows that gold price could retest the $1800 mark.

Gold price closed in the green for the second straight week on Friday, as the bulls received a fresh boost from the above-forecasts US Nonfarm Payrolls (NFP) headline numbers, which triggered a sharp profit-taking slide in the dollar from near two-month peaks. Markets took the upbeat US jobs data as an excuse to take profits off the table on ‘sell the fact’ trading, as they expected stronger NFP figures to stoke up the Fed’s tapering expectations. The NFP came in at 850K in June vs. 700K expected and 559K previous. Meanwhile, the record run on Wall Street also failed to deter the gold bulls, as the price recaptured the critical 100-Daily Moving Average (DMA) at $1790 to reach fresh two-week highs at $1795. Gold price, however, failed to deliver a closing above that key hurdle.
That said, gold price is struggling below the 100-DMA barrier this Monday, partly lagged by the broad-based US dollar rebound, as investors reassess the odds for the Fed’s hawkish hand ahead of this week’s FOMC minutes. Further, risk-aversion sweeps off the Asian markets after China’s Caixin Services PMI fell to a 14-month low at 50.3, lifting the haven demand for the greenback while capping gold’s upside. In the day ahead, the dollar’s dynamics and broader market sentiment will influence gold price action, as traders brace for the US ISM Services PMI for fresh near-term trading opportunities.
Gold Price Chart - Technical outlook
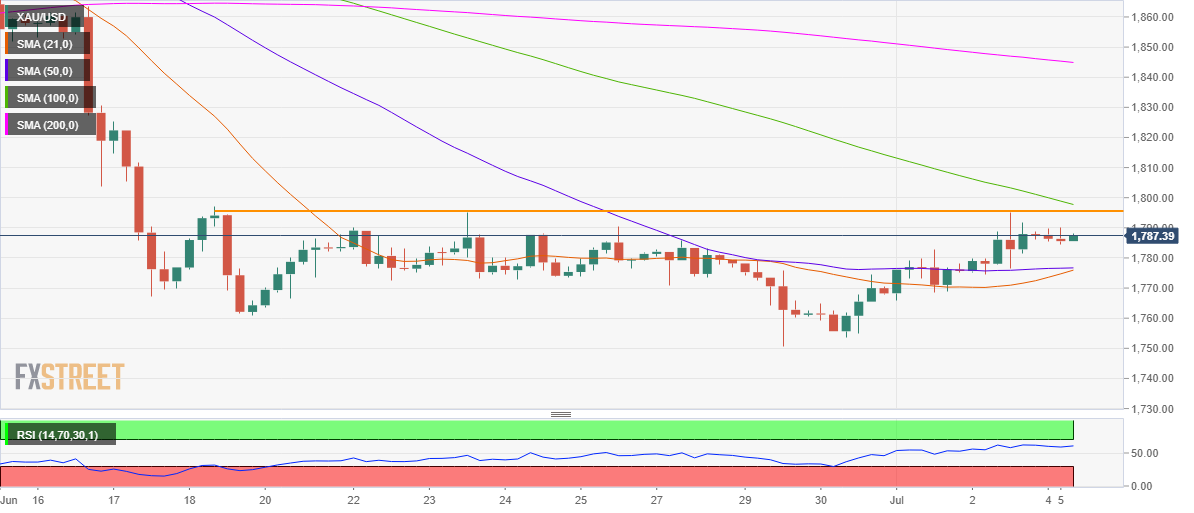
Gold: Four-hour chart
As observed on the four-hour chart, gold price is flat-lined below a horizontal (orange) trendline resistance at $1795. Just above that level, a downward sloping 100-Simple Moving Average (SMA) at $1798 appears.
Therefore, gold bulls need a decisive break above the said resistance zone, in order to extend its recent upbeat momentum to challenge $1800.
Acceptance above the $1800 round figure will expose the next resistance at $1812, June 17 high.
The Relative Strength Index (RSI) is edging higher above the midline, suggesting that there is room to rise in the near term.
Adding credence to a potential move higher, gold price is on the verge of confirming a bull cross, with the 21-SMA looking to cut the horizontal 50-SMA from below.
Alternatively, immediate support is seen at the 21 and 50-SMAs confluence, now at $1776. Sellers will then target the static support at $1770.
Further down, bears could challenge the two-month lows of $1751 reached last week.
Premium
You have reached your limit of 3 free articles for this month.
Start your subscription and get access to all our original articles.
Author

Dhwani Mehta
FXStreet
Residing in Mumbai (India), Dhwani is a Senior Analyst and Manager of the Asian session at FXStreet. She has over 10 years of experience in analyzing and covering the global financial markets, with specialization in Forex and commodities markets.