Gold Price Forecast: XAU/USD looks north, with eyes on $1814 and $1820 – Confluence Detector
- Gold price eyes a sustained move above $1800 amid USD weakness.
- Market sentiment remains mixed ahead of a critical week.
- Gold bears and bulls fight over $1,800, focus shifts to US GDP.

Gold price is once again testing offers above the $1800 mark, as the bulls look for acceptance above the latter after Friday’s quick retracement from six-week tops of $1814. As risk remains relatively firmer on Monday, courtesy of easing China’s property sector concerns, the US dollar keeps losing additional ground vs. its main competitors, benefiting gold price. Meanwhile, with persistent rising inflation fears amid supply chain crisis and surging energy costs, gold price is likely to keep the upper hand as an inflation hedge.
Read: Gold Price Forecast: A big technical breakout in the offing. Where is XAU/USD headed next?
Gold Price: Key levels to watch
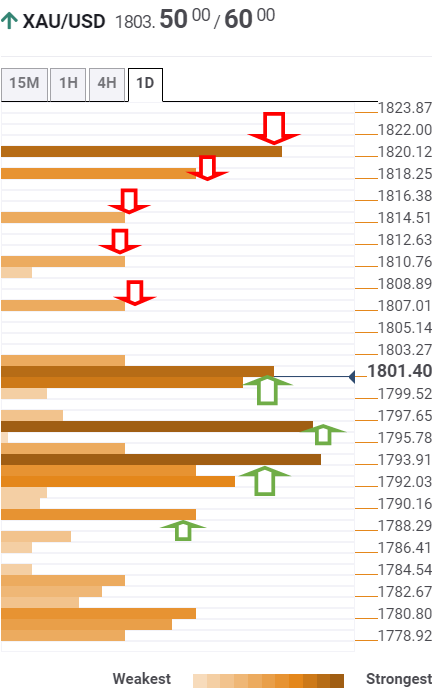
The Technical Confluences Detector shows that gold has recaptured the $1800 mark, with bulls unstoppable, as they target the Fibonacci 23.6% one-day at $1807.
If the buying interest accelerates, then a test of the pivot point one-day R1 at $1811 will be soon on the cards.
The next stop for gold bulls is seen at the previous day’s high of $1814, above which the pivot point one-week R1 at $1818 will be challenged.
Further up, powerful resistance of the pivot point one-month R1 at $1820 will be a tough nut to crack for gold optimists.
Alternatively, sellers will probe the strong resistance-turned-support around $1800, which is the convergence of the Fibonacci 38.2% one-day, Fibonacci 23.6% one-week and Bollinger Band one-day Upper.
Gold bears will then look out for the $1796 cap, which is the SMA5 four-hour.
Further south, a dense cluster of healthy support levels around $1793 will test the bullish commitments.
That area is the intersection of the Fibonacci 38.2% one-week, Fibonacci 61.8% one-day, SMAs100 and 200 one-day.
The last line of defense for gold buyers is the SMA50 one-hour at $1789.
Here is how it looks on the tool
About Technical Confluences Detector
The TCD (Technical Confluences Detector) is a tool to locate and point out those price levels where there is a congestion of indicators, moving averages, Fibonacci levels, Pivot Points, etc. If you are a short-term trader, you will find entry points for counter-trend strategies and hunt a few points at a time. If you are a medium-to-long-term trader, this tool will allow you to know in advance the price levels where a medium-to-long-term trend may stop and rest, where to unwind positions, or where to increase your position size.
Author

Dhwani Mehta
FXStreet
Residing in Mumbai (India), Dhwani is a Senior Analyst and Manager of the Asian session at FXStreet. She has over 10 years of experience in analyzing and covering the global financial markets, with specialization in Forex and commodities markets.


