Cardano Price Analysis: Approaches key trendline amid bearish sentiment
- Cardano price is nearing its descending trendline on Thursday, with a breakout or rejection likely to dictate the next directional move.
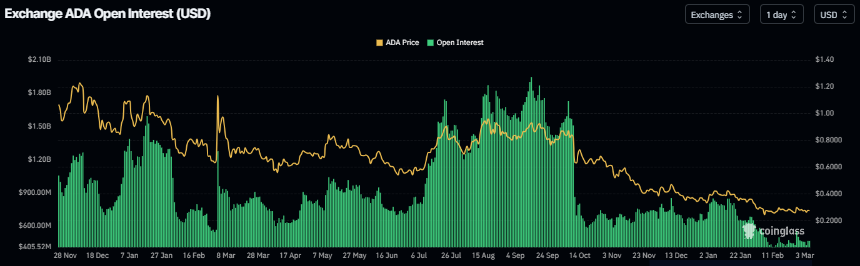
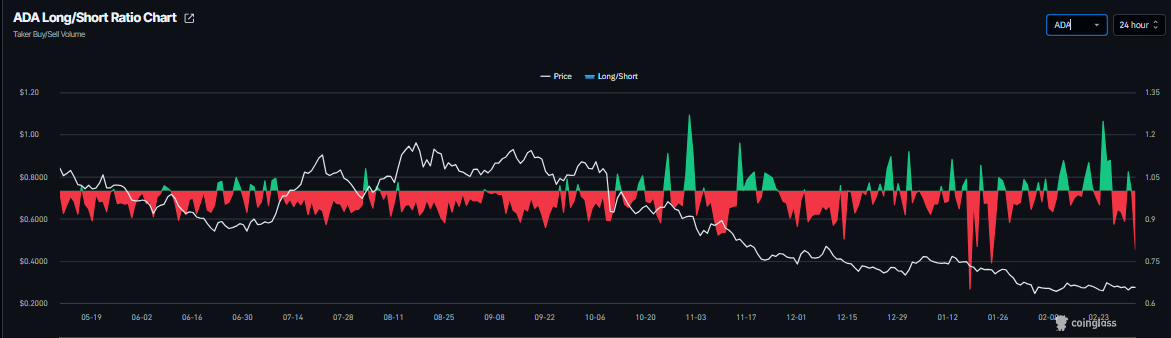
- Derivatives data supports a bearish case as open interest declines while short positions increase among traders.
- The technical outlook remains cautiously neutral, with a downside tilt, as the trendline continues to hold as resistance.

Cardano (ADA) price is approaching its descending trendline around $0.28 at the time of writing on Thursday, set to shape the next directional move. The derivatives metrics paint a bearish picture, with ADA’s Open Interest (OI) continuing to fall and short bets rising among traders. On the technical side, price action holds below the long-standing descending trendline, keeping the downside bias intact.
Cardano’s derivatives data shows a bearish bias
Cardano’s futures Open Interest (OI) dropped to $462 million on Thursday and has been continuously falling since mid-January. This drop in OI reflects waning investor participation and projects a bearish outlook.
In addition, CoinGlass’s ADA long-to-short ratio, currently at 0.79, is near its lowest level in over a month. This ratio, below one, reflects bearish sentiment in the markets, as more traders are betting on the asset price to fall.
Cardano Price Forecast: Descending trendline caps recovery
Cardano price is trading at $0.27 as of Thursday. The near-term bias is cautiously neutral with a downside tilt as price holds below the long-standing descending resistance trendline that was recently tested near $0.28 and rejected.
ADA also trades well under the 50- and 100-day Exponential Moving Averages (EMAs) clustered above $0.30, underscoring a broader bearish context despite the latest stabilization.
The Relative Strength Index (RSI) on the daily chart near 46 recovers from prior oversold readings but remains below the 50 midline, showing only modest improvement in momentum. The Moving Average Convergence Divergence (MACD) indicator stays in positive territory with the MACD line just above the signal line and a flat histogram, which reinforces a consolidative tone rather than a clean bullish reversal.
Initial resistance is found at the trendline break area around $0.28, with a stronger cap at the horizontal barrier near $0.32 that coincides with the descending EMAs and defines the upper boundary of any rebound. A daily close above $0.32 would be needed to negate the prevailing bearish structure and open the way to a more sustainable recovery phase.
On the downside, immediate support sits at the recent reaction lows around $0.26, followed by the horizontal support at $0.24, where prior buying interest emerged. A break below $0.24 would expose the pair to renewed selling pressure and extend the broader downtrend, while holding above this floor keeps ADA locked in a range between $0.26 and $0.29 for now.
(The technical analysis of this story was written with the help of an AI tool.)
Author

Manish Chhetri
FXStreet
Manish Chhetri is a crypto specialist with over four years of experience in the cryptocurrency industry.



