Gold Price Forecast: A big technical breakout in the offing. Where is XAU/USD headed next?
- Gold price extends its five-day winning streak amid inflation and covid fears.
- USD, Treasury yields lick wounds after Fed’s Powell douses rate hike bets.
- Gold eyes symmetrical triangle breakout on the 1D chart, focus on Monday’s close.

Gold price rallied hard on Friday, storming through the $1800 barrier to reach six-week highs at $1814. Although the bulls failed to sustain at higher and pared-back gains, as gold price finished the week below the critical 200-Daily Moving Average (DMA) as well as the $1800 threshold. Despite the quick retracement, gold price booked the second straight weekly gain, as the US dollar meandered in three-week lows against its main peers.
The bright metal got a boost from a sharp correction in the US Treasury yields from near multi-month highs after Fed Chair Jerome Powell said on Friday it was time to start rolling back asset purchases, though not yet time to kick off the rate hike cycle. Powell’s comments boded ill for the greenback as well while aiding the Wall Street rebound. The record run in the US indices capped gold’s upside attempts. From a broader perspective, growing inflationary pressures-led stagflation worries helped keep the buoyant tone intact around gold price.
On the first trading day of a big week, gold price remains on the front foot, trading close to $1800, as the dollar and yields lick their wounds. Investors remain in a wait-and-see mode heading into a raft of key earnings reports from the American tech titans, growth numbers from the US and the EU and the European Central Bank’s (ECB) monetary policy decision this week. However, gold price may continue to find support from the renewed covid worries, and global growth concerns amid looming inflation risks. Investors will assess a delta-variant virus outbreak in China that could exacerbate the pain in the country’s indebted real-estate sector. Although the fresh optimism over a potential improvement in China’s property sector is lifting the overall market mood, underpinning gold price at the expense of the safe-haven gold.
Looking forward, the risk trends, the price action in the yields and the buck will continue to influence gold price amid a blackout period for the Fed and a quiet start to the week.
Gold Price Chart - Technical outlook
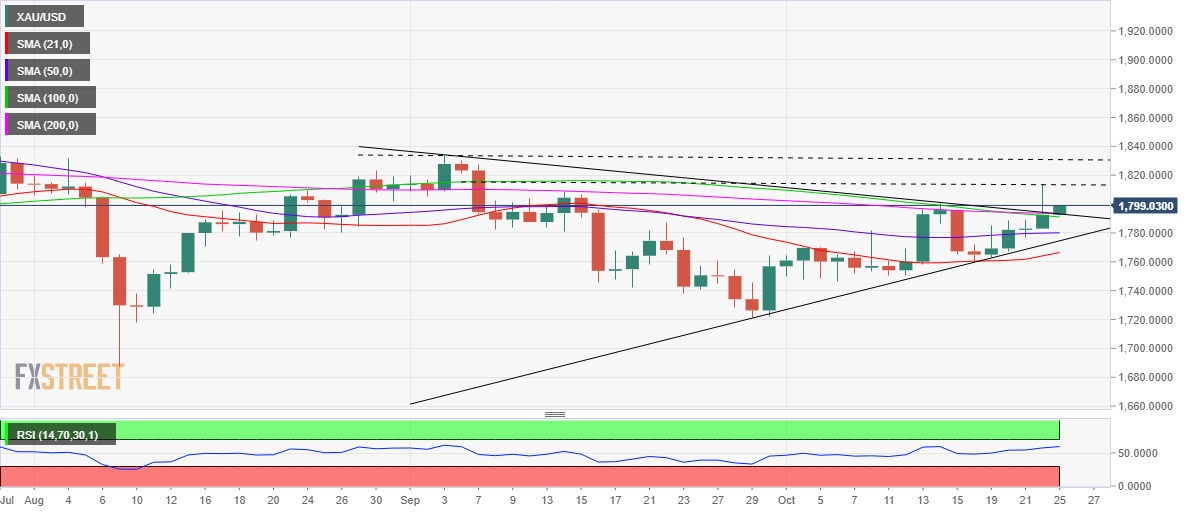
Gold: Daily chart
As observed on the daily chart, gold price is teasing a symmetrical triangle breakout, with bulls awaiting a daily closing above the falling trendline resistance at $1793.
The 14-day Relative Strength Index (RSI) looks north, well above the midline, adding credence to the bullish outlook.
The triangle breakout will open doors for a fresh uptrend towards the $1900 barrier. Ahead of that the previous week’s high of $1814 will offer stiff resistance.
Further up, September highs at $1834 will also emerge as a tough nut to crack for gold bulls.
On the flip side, the immediate downside appears cushioned around $1793-$1791, the intersection of the falling trendline resistance now support, 100 and 200-DMAs.
The next critical support awaits at the horizontal 50-DMA at $1780. Selling resurgence could knock off gold price further towards the rising trendline support at $1775.
Premium
You have reached your limit of 3 free articles for this month.
Start your subscription and get access to all our original articles.
Author

Dhwani Mehta
FXStreet
Residing in Mumbai (India), Dhwani is a Senior Analyst and Manager of the Asian session at FXStreet. She has over 10 years of experience in analyzing and covering the global financial markets, with specialization in Forex and commodities markets.


