Gold Price Forecast: XAU/USD licks its wounds above $1,900, eyes on United States Treasury bond yields, NFP
- Gold Price bounces off three-week low but brace for the biggest weekly loss since mid-June.
- Downside break of key technical supports, overall firmer US Dollar weigh on XAU/USD price.
- Mostly upbeat US data, China news and United States Treasury bond yields propel Greenback, favoring Gold sellers.
- Gold bears need stronger US NFP, softer Unemployment Rate to keep reins.

Gold Price (XAU/USD) portrays the typical pre-data consolidation as market braces for the United States employment report for June, up 0.10% intraday near $1,935 during early Friday. In doing so, the XAU/USD price recovers from the lowest level in three weeks, marked the previous day. Apart from the pre-data positioning, inactive US Treasury bond yields also allow the Gold Price to portray a corrective bounce off the multi-day low.
Gold Price recovers as markets prepare for key United States data, yields dribble
Gold Price recovers amid a retreat in the US Dollar and sluggish bond market moves. However, looming fears of the Federal Reserve’s (Fed) September rate hike, as well as the market’s risk-off mood, and the US Treasury bond yields’ positioning at worrisome levels challenge the XAU/USD buyers.
The recently released United States statistics have been mostly upbeat and suggest one more rate hike in 2023 by the Fed, even if the odds are too low of late. Additionally, economic fears emanating from the US credit rating downgrade and the US-China tension are extra positives for the US Dollar, which in turn weigh on the Gold price.
That said, US ISM Services PMI dropped to 52.7 for July from 53.9 prior, versus 53.0 market forecasts. The details of the ISM Services Survey unveiled that Employment Index and New Order Index also came in softer but the Prices Paid jumped to a three-month high.
Further, the US Factory Orders improved to 2.3% MoM for June versus 0.4% prior (revised) and 2.2% market forecasts while Initial Jobless Claims matches 227K expected figures for the week ended on July 28 from 221K prior.
Additionally, the preliminary readings of the Nonfarm Productivity for the second quarter (Q2) rallied by 3.7% compared to the 2.0% expected and -1.2% previous readings whereas Unit Labor Cost eased to 1.6% for the said period versus 2.6% consensus and 3.3% prior.
Elsewhere, the US policymakers rush to defend the Treasury bonds after Fitch Ratings cut the US credit ratings to AA+ from AAA. The same joined the ongoing US-China tension, as well as fears of softer economic growth in China, to weigh on the sentiment and the XAU/USD. Recently, Reuters came out with the news stating that Key Republican urges Biden to set broad restrictions on US investments in China. On the other hand, People's Bank of China governor Pan Gongsheng was spotted meeting big property developers from China and assured them to provide the needed help to defend the housing sector.
Amid these plays, S&P500 Futures print mild gains and the US Treasury bond yields remain sidelined at the multi-day high, which in turn prod the US Dollar buyers and allow the Gold Price to edge higher. That said, the US 10-year Treasury bond yields rose to a fresh high since November 2022 before ending the trading day near 4.18% whereas the Wall Street benchmark marked mild losses by the end of Thursday’s North American session. It’s worth noting that the US bond coupons were heading towards the worrisome levels that previously triggered economic hardships, which in turn tease the US Dollar bulls due to its haven allure and weigh on the XAU/USD.
US NFP is the key for XAU/USD bears to defend weekly fall
While nothing much is happening in other risk areas, the Gold sellers will keep their eyes on the United States employment report for July for clear directions, to justify the Federal Reserve’s (Fed) September rate hike and favor US Dollar bulls.
That said, the early signals for the employment report have been positive but the headline Nonfarm Payrolls (NFP) bears downbeat market forecasts, likely softening to 200K versus 209K prior. Further, the Unemployment Rate is likely to remain static at 3.6%.
Also read: Gold Price Forecast: US Dollar firmer ahead of Nonfarm Payrolls report
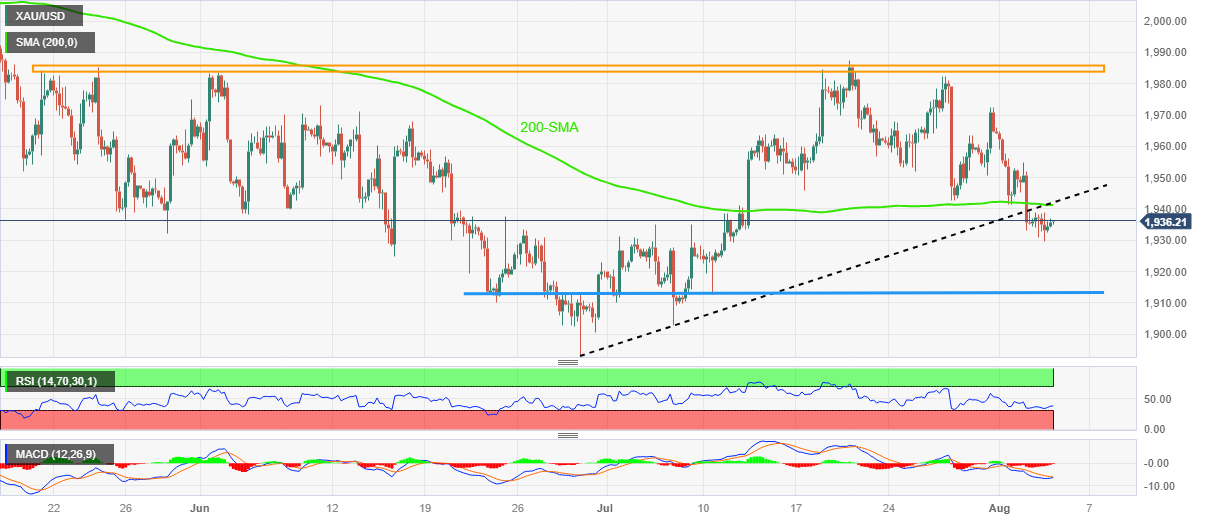
Gold Price Technical Analysis
Gold Price justifies the downside break of a five-week-old ascending trend line and 200-SMA while keeping sellers on the lookout for further south-run.
That said, the Moving Average Convergence and Divergence (MACD) indicator’s bearish signals add credence to the downside bias but nearly oversold conditions of the Relative Strength Index (RSI) line, placed at 14, puts a floor under the XAU/USD price.
Apart from the downbeat RSI, a slew of peaks and troughs marked since mid-June also challenge the Gold sellers near $1,930.
Following that, a six-week-old horizontal support zone near $1,915 and the $1,900 round, quickly followed by the yearly low marked in June around $1,893, will entertain the XAU/USD bears.
Meanwhile, a convergence of the 200-SMA and the support-turned-resistance line stretched from late June, close to $1,940 at the latest, guards immediate recovery of the Gold Price.
In a case where the XAU/USD remains firmer past $1,940, the weekly top of around $1,972 may lure the bulls before challenging them with an area comprising multiple tops marked since May 19, around $1,985 by the press time.
To sum up, the Gold Price appears well set to witness further downside even if the road towards the south is long and bumpy.
Gold Price: Four-hour chart
Trend: Further downside expected
Author

Anil Panchal
FXStreet
Anil Panchal has nearly 15 years of experience in tracking financial markets. With a keen interest in macroeconomics, Anil aptly tracks global news/updates and stays well-informed about the global financial moves and their implications.


