Gold Price Forecast: XAU/USD gathers strength to capture $2,050 as US economy eyes recession


  • Gold price is aiming to capture the critical resistance of $2,050.00 as USD Index is eyeing more downside.
  • Reduced borrowing by US banks from the Fed is advocating further slowdown in the US economy.
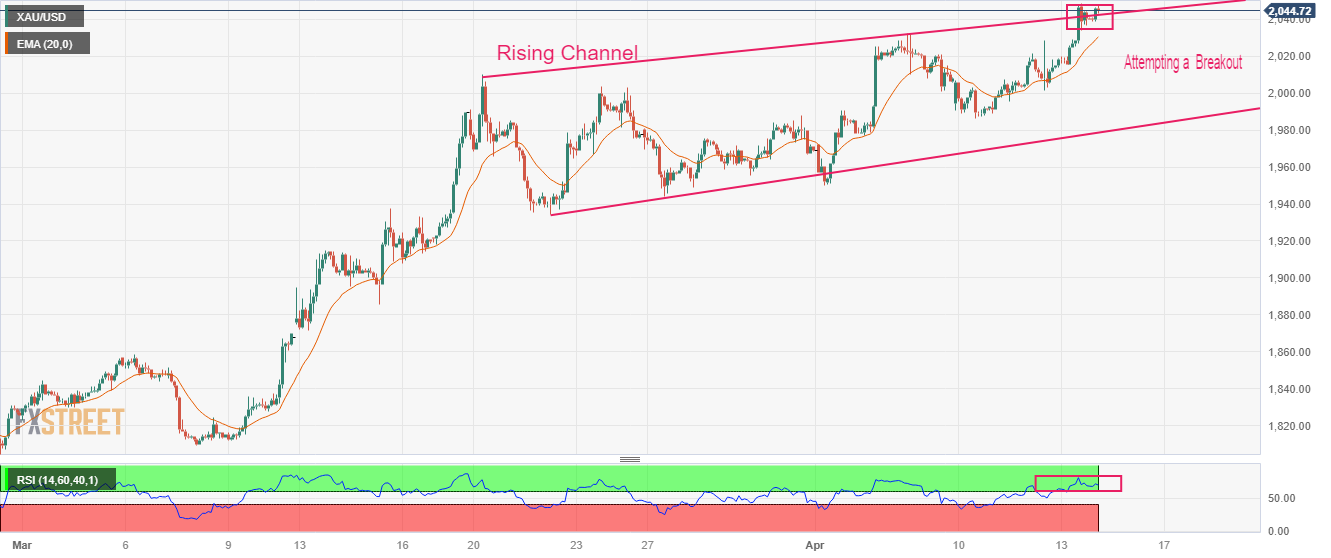
  • Gold price is on the verge of delivering a breakout of the Rising Channel pattern.

Gold price (XAU/USD) is gathering strength to capture the critical resistance of $2,050.00 in the Asian session. The precious metal is looking to resume its upside journey after mild exhaustion in the upside momentum.

S&P500 futures are showing choppy moves in the Asian session after witnessing stellar buying on Thursday, portraying a risk appetite theme underpinned by the market participants. The US Dollar Index (DXY) has refreshed its 11-month low at 100.80 and is eyeing more weakness as investors are anticipating that the Federal Reserve (Fed) will look for pausing rate hikes after May monetary policy meeting.

Bloomberg reported that United States commercial banks reduced their borrowings from two Federal Reserve backstop lending facilities for a fourth straight week as liquidity constraints continue to ease following the collapse of Silicon Valley Bank last month. Lower credit disposal due to tight credit conditions could slow down the US economy, which might ease inflationary pressures sooner and force Fed chair Jerome Powell to wrap up the policy-tightening spell sooner.

On Friday, a power-pack action is expected from the USD Index amid the release of the US Retail Sales data. According to the consensus, the economic data will contract by 0.4%. The retail demand is likely to continue the pace of contraction as shown in February as US labor market conditions are cooling down.

Gold technical analysis

Gold price is auctioning in a Rising Channel chart pattern on a two-hour scale in which every pullback is capitalized for building fresh longs by the market participants. The yellow metal is consolidating near the breakout region of the aforementioned chart pattern.

Advancing 20-period Exponential Moving Average (EMA) at $2,031.00 is favoring more upside for Gold bulls.

The Relative Strength Index (RSI) (14) is oscillating in the bullish range of 60.00-80.00, indicating that the upside momentum is already active.

Gold two-hour chart

XAU/USD

Overview
Today last price 2045.16
Today Daily Change 5.16
Today Daily Change % 0.25
Today daily open 2040
 
Trends
Daily SMA20 1984.88
Daily SMA50 1905.21
Daily SMA100 1872.96
Daily SMA200 1792.38
 
Levels
Previous Daily High 2048.75
Previous Daily Low 2013.8
Previous Weekly High 2032.11
Previous Weekly Low 1949.83
Previous Monthly High 2009.88
Previous Monthly Low 1809.46
Daily Fibonacci 38.2% 2035.4
Daily Fibonacci 61.8% 2027.15
Daily Pivot Point S1 2019.62
Daily Pivot Point S2 1999.23
Daily Pivot Point S3 1984.67
Daily Pivot Point R1 2054.57
Daily Pivot Point R2 2069.13
Daily Pivot Point R3 2089.52


Share: Feed news

Information on these pages contains forward-looking statements that involve risks and uncertainties. Markets and instruments profiled on this page are for informational purposes only and should not in any way come across as a recommendation to buy or sell in these assets. You should do your own thorough research before making any investment decisions. FXStreet does not in any way guarantee that this information is free from mistakes, errors, or material misstatements. It also does not guarantee that this information is of a timely nature. Investing in Open Markets involves a great deal of risk, including the loss of all or a portion of your investment, as well as emotional distress. All risks, losses and costs associated with investing, including total loss of principal, are your responsibility. The views and opinions expressed in this article are those of the authors and do not necessarily reflect the official policy or position of FXStreet nor its advertisers. The author will not be held responsible for information that is found at the end of links posted on this page.

If not otherwise explicitly mentioned in the body of the article, at the time of writing, the author has no position in any stock mentioned in this article and no business relationship with any company mentioned. The author has not received compensation for writing this article, other than from FXStreet.

FXStreet and the author do not provide personalized recommendations. The author makes no representations as to the accuracy, completeness, or suitability of this information. FXStreet and the author will not be liable for any errors, omissions or any losses, injuries or damages arising from this information and its display or use. Errors and omissions excepted.

The author and FXStreet are not registered investment advisors and nothing in this article is intended to be investment advice.

Recommended content


Recommended content

Editors’ Picks

EUR/USD holds above 1.0700 ahead of key US data

EUR/USD holds above 1.0700 ahead of key US data

EUR/USD trades in a tight range above 1.0700 in the early European session on Friday. The US Dollar struggles to gather strength ahead of key PCE Price Index data, the Fed's preferred gauge of inflation, and helps the pair hold its ground. 

EUR/USD News

USD/JPY jumps above 156.00 on BoJ's steady policy

USD/JPY jumps above 156.00 on BoJ's steady policy

USD/JPY has come under intense buying pressure, surging past 156.00 after the Bank of Japan kept the key rate unchanged but tweaked its policy statement. The BoJ maintained its fiscal year 2024 and 2025 core inflation forecasts, disappointing the Japanese Yen buyers. 

USD/JPY News

Gold price flatlines as traders look to US PCE Price Index for some meaningful impetus

Gold price flatlines as traders look to US PCE Price Index for some meaningful impetus

Gold price lacks any firm intraday direction and is influenced by a combination of diverging forces. The weaker US GDP print and a rise in US inflation benefit the metal amid subdued USD demand. Hawkish Fed expectations cap the upside as traders await the release of the US PCE Price Index.

Gold News

Sei Price Prediction: SEI is in the zone of interest after a 10% leap

Sei Price Prediction: SEI is in the zone of interest after a 10% leap

Sei price has been in recovery mode for almost ten days now, following a fall of almost 65% beginning in mid-March. While the SEI bulls continue to show strength, the uptrend could prove premature as massive bearish sentiment hovers above the altcoin’s price.

Read more

US core PCE inflation set to signal firm price pressures as markets delay Federal Reserve rate cut bets

US core PCE inflation set to signal firm price pressures as markets delay Federal Reserve rate cut bets

The core PCE Price Index, which excludes volatile food and energy prices, is seen as the more influential measure of inflation in terms of Fed positioning. The index is forecast to rise 0.3% on a monthly basis in March, matching February’s increase. 

Read more

Forex MAJORS

Cryptocurrencies

Signatures