- Gold price has failed to recapture the critical resistance of $1,930.00 as USD Index rebounds.
- The precious metal might continue its upside momentum as the Fed is expected to trim the policy tightening pace.
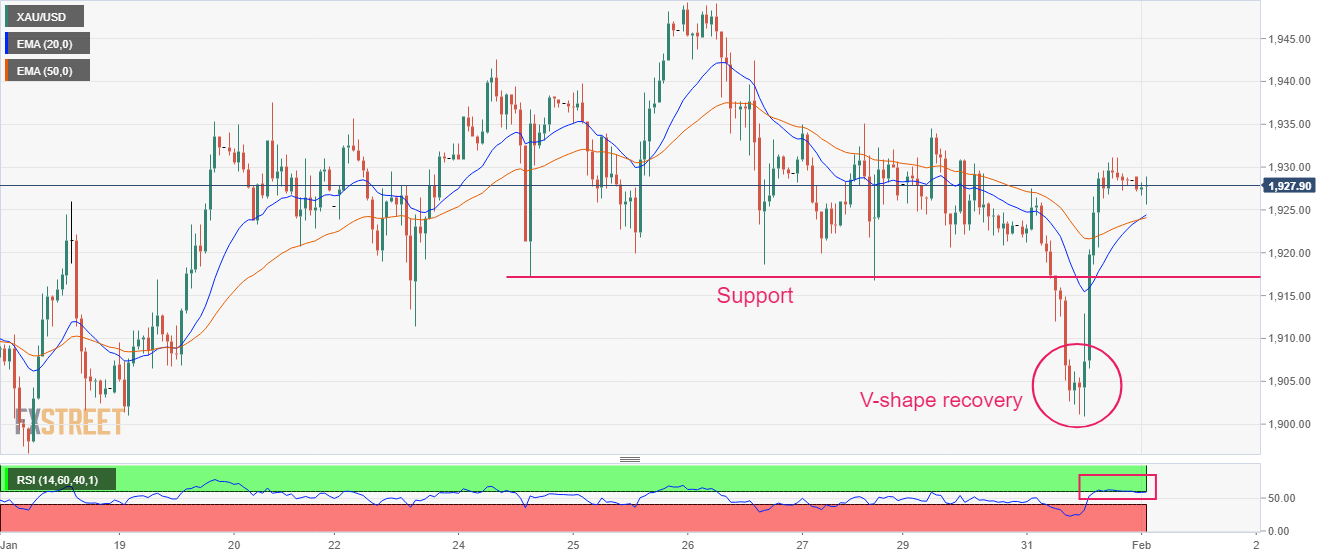
- Gold price has shown a V-shape recovery after dropping near the round-level resistance of $1,900.00.
Gold price (XAU/USD) has corrected sharply after failing to recapture the critical resistance of $1,930.00 in the Asian session. The precious metal has witnessed a loss in the upside momentum as the US Dollar Index (DXY) is showing signs of recovery after dropping to near 101.70. The USD Index is gaining traction as investors are getting anxious ahead of the interest rate decision by the Federal Reserve (Fed).
The correction in the Gold price seems mild as Fed chair Jerome Powell is expected further to decelerate the pace of the interest rate hike. Meanwhile, S&P500 futures have eased some gains recorded on Tuesday as investors believe that further interest rate hikes by the Fed will escalate recession fears in the United States. The 10-year US Treasury yields have dropped below 3.52%.
Apart from the Fed’s monetary policy, US Automatic Data Processing (ADP) Employment data and ISM Manufacturing PMI will be of utmost importance. As per the consensus, the US economy added 170K new jobs in January from the former release of 235K. While the Manufacturing PMI is expected to decline to 48.0 against 48.4, released earlier.
For a longer horizon, Reuters noted that higher interest rates by the Fed would limit the Gold price ahead. According to the Reuters poll, Gold price is expected to average $1,852.50 in 2023 and $1,890 in 2024.
Gold technical analysis
Gold price has shown a V-shape recovery after dropping near the round-level resistance of $1,900.00 on an hourly scale. The precious metal has managed to shift its action above the horizontal resistance, which has become a support now, plotted from January 24 low at $1,914.19.
A bull cross, represented by the 20-and 50-period Exponential Moving Averages (EMAs) at $1,924.06, adds to the upside filters.
However, the Relative Strength Index (RSI) (14) still needs to show a confident bullish range shift for upside momentum.
Gold hourly chart
Information on these pages contains forward-looking statements that involve risks and uncertainties. Markets and instruments profiled on this page are for informational purposes only and should not in any way come across as a recommendation to buy or sell in these assets. You should do your own thorough research before making any investment decisions. FXStreet does not in any way guarantee that this information is free from mistakes, errors, or material misstatements. It also does not guarantee that this information is of a timely nature. Investing in Open Markets involves a great deal of risk, including the loss of all or a portion of your investment, as well as emotional distress. All risks, losses and costs associated with investing, including total loss of principal, are your responsibility. The views and opinions expressed in this article are those of the authors and do not necessarily reflect the official policy or position of FXStreet nor its advertisers. The author will not be held responsible for information that is found at the end of links posted on this page.
If not otherwise explicitly mentioned in the body of the article, at the time of writing, the author has no position in any stock mentioned in this article and no business relationship with any company mentioned. The author has not received compensation for writing this article, other than from FXStreet.
FXStreet and the author do not provide personalized recommendations. The author makes no representations as to the accuracy, completeness, or suitability of this information. FXStreet and the author will not be liable for any errors, omissions or any losses, injuries or damages arising from this information and its display or use. Errors and omissions excepted.
The author and FXStreet are not registered investment advisors and nothing in this article is intended to be investment advice.
Recommended content
Editors’ Picks
EUR/USD edges lower toward 1.0700 post-US PCE

EUR/USD stays under modest bearish pressure but manages to hold above 1.0700 in the American session on Friday. The US Dollar (USD) gathers strength against its rivals after the stronger-than-forecast PCE inflation data, not allowing the pair to gain traction.
GBP/USD retreats to 1.2500 on renewed USD strength

GBP/USD lost its traction and turned negative on the day near 1.2500. Following the stronger-than-expected PCE inflation readings from the US, the USD stays resilient and makes it difficult for the pair to gather recovery momentum.
Gold struggles to hold above $2,350 following US inflation

Gold turned south and declined toward $2,340, erasing a large portion of its daily gains, as the USD benefited from PCE inflation data. The benchmark 10-year US yield, however, stays in negative territory and helps XAU/USD limit its losses.
Bitcoin Weekly Forecast: BTC’s next breakout could propel it to $80,000 Premium

Bitcoin’s recent price consolidation could be nearing its end as technical indicators and on-chain metrics suggest a potential upward breakout. However, this move would not be straightforward and could punish impatient investors.
Week ahead – Hawkish risk as Fed and NFP on tap, Eurozone data eyed too

Fed meets on Wednesday as US inflation stays elevated. Will Friday’s jobs report bring relief or more angst for the markets? Eurozone flash GDP and CPI numbers in focus for the Euro.