Gold Price Forecast: XAU/USD faces a wall of resistance en-route $1,800 – Confluence Detector
- Gold price rebounds but not out of the woods yet while below $1,800.
- Omicron covid variant woes will continue to play out, impacting USD and gold.
- Gold looks to extend rebound amid renewed coronavirus fears.

Gold is looking to find its feet on Monday after wild swings witnessed on Friday, as the world was once again rattled by fresh concerns over a new covid variant detected in South Africa. The renewed virus concerns continue to underpin gold’s safe-haven appeal while markets reassess the Fed’s tightening expectations. Investors are likely to remain edgy amid choppy markets, as the latest covid updates and risk sentiment will continue to dominate.
Read: Gold Price Forecast: XAU/USD needs to find acceptance above $1,800 to negate the bearish bias
Gold Price: Key levels to watch
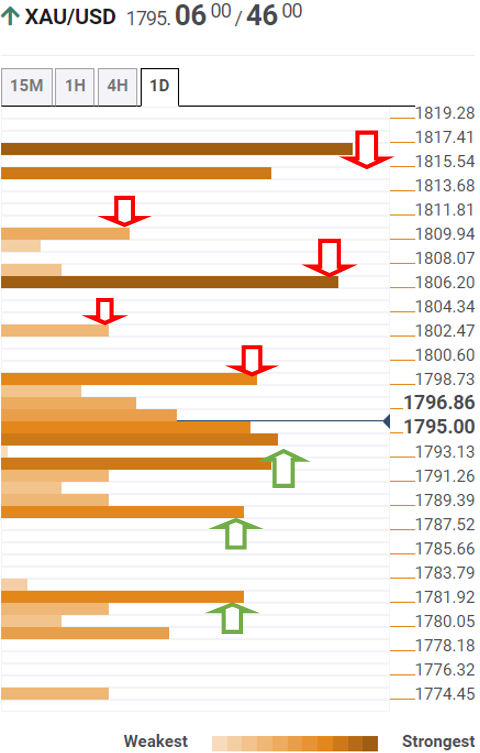
The Technical Confluences Detector shows that the gold price is likely to face a stubborn resistance at $1,799-$1,800, which is the intersection of the Fibonacci 23.6% one-month and Bollinger Band one-hour Middle.
If the latter caves in, then the Fibonacci 61.8% one-day at $1,802 could get tested. Further up, gold bulls will need extra zest to take out the critical Fibonacci 38.2% one-week at $1,807.
The confluence of the SMA200 four-hour and pivot point one-day R1 at $1,809 will challenge the bearish commitments.
The next stop for gold bulls is seen around $1,816, where the previous week’s high, previous month’s high and pivot point one-month R1 merge.
On the flip side, the immediate downside seems guarded by a dense cluster of healthy support levels around $1,795.
At that point, the Fibonacci 23.6% one-week coincides with the SMA100 one-day, Fibonacci 38.2% one-day and SMA200 one-day.
The next demand area at $1,789, the Fibonacci 38.2% one-month, will come into play, below which floors will open up towards Friday’s low of $1,780.55.
Here is how it looks on the tool
About Technical Confluences Detector
The TCD (Technical Confluences Detector) is a tool to locate and point out those price levels where there is a congestion of indicators, moving averages, Fibonacci levels, Pivot Points, etc. If you are a short-term trader, you will find entry points for counter-trend strategies and hunt a few points at a time. If you are a medium-to-long-term trader, this tool will allow you to know in advance the price levels where a medium-to-long-term trend may stop and rest, where to unwind positions, or where to increase your position size.
Author

Dhwani Mehta
FXStreet
Residing in Mumbai (India), Dhwani is a Senior Analyst and Manager of the Asian session at FXStreet. She has over 10 years of experience in analyzing and covering the global financial markets, with specialization in Forex and commodities markets.


