Gold Price Forecast: XAU/USD needs to find acceptance above $1,800 to negate the bearish bias
- Gold price rebounds but not out of the woods yet amid a rebound in yields.
- The US dollar keeps the upper hand amid Omicron covid strain jitters.
- Gold’s path of least resistance appears to the downside, per 4H chart.

Gold price put up a great show on Friday amid a volatile session, in the face of the Thanksgiving holiday break, resurgence covid fears and month-end flows. Although gold price ended flat, it did offer good two-way businesses for traders. The bright metal picked up fresh bids and rebound sharply to $1,816 in the first half of the day, as the new Omicron covid variant sparked a rush to safety to the traditional safe-havens while knocking down the Treasury yields across the curve.
However, in the American session, gold price sold-off into the month-end flows and light trading, falling back to test the $1,780 support area before closing the week below the $1,800 threshold. The late rebound in the US dollar collaborated with the pullback in gold price from four-day highs.
On Monday, gold price extended Friday’s late rebound and advanced towards $1,800 in Asian trade, although sellers continued to lurk just below the latter amid firmer US dollar and improving risk sentiment. Fears over new covid strain detected in South Africa eased somewhat amid expectations that its impact may not be so severe as that seen in the Delta outbreak. The Treasury yields rebounded in tandem with risk appetite, capping gold’s renewed upside. The S&P 500 futures also jumped over 1%, reflecting the stabilizing market mood.
In the day, the latest developments surrounding the new variant combined with the market’s reassessment of the global tightening expectations will lead the sentiment, impacting the dollar’s as well as gold’s valuations. Investors will also look forward to the speeches from Fed Chair Jerome Powell and ECB President Christine Lagarde for fresh trading incentives, in absence of any first-tier economic news from the US.
Gold Price Chart - Technical outlook
Gold: Four-hour chart
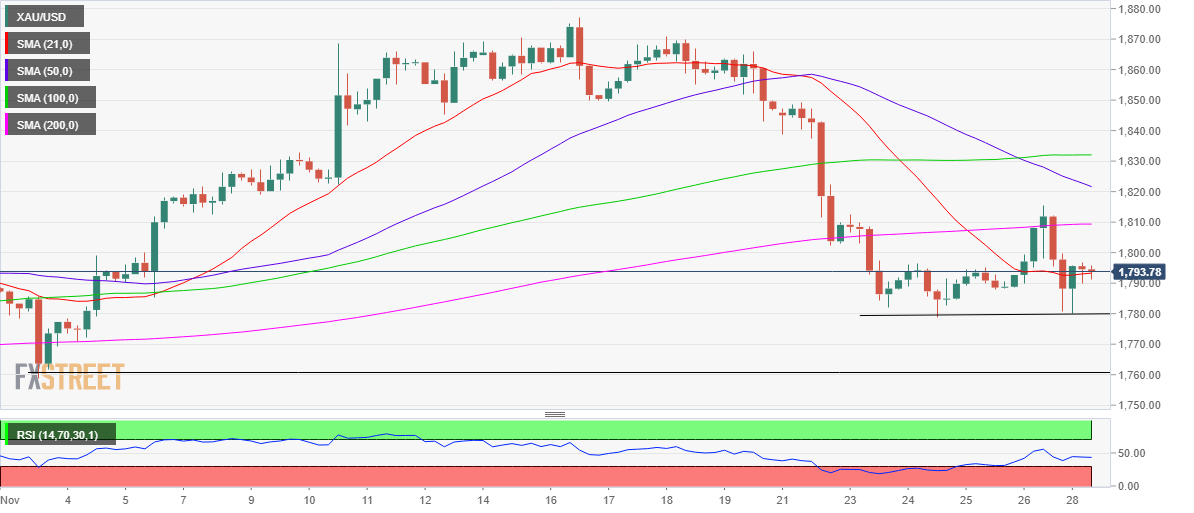
On the four-hour chart, it can be seen that gold price is trading around the 21-Simple Moving Average (SMA) at $1,793.
The Relative Strength Index (RSI) is trading flatlined but below the 50 level, suggesting that the renewed upside could remain short-lived unless the metal finds acceptance above the $1,800 level.
Strong support awaits around $1,780, the previous week’s lower range, below which the November 3 low of $1,859 will be on the sellers’ radars.
On the flip side, the bulls need to hold the 21-SMA support for a fresh advance towards the horizontal 200-SMA at $1,809.
The buyers will then look to retest Friday’s high of $1,816 if the rebound gathers steam going forward.
Author

Dhwani Mehta
FXStreet
Residing in Mumbai (India), Dhwani is a Senior Analyst and Manager of the Asian session at FXStreet. She has over 10 years of experience in analyzing and covering the global financial markets, with specialization in Forex and commodities markets.


