|

Gold Price Forecast: XAU/USD eyes $1,950 as US Dollar Index cracks, US Q4 GDP eyed

  • Gold price is looking to test the $1,950.00 resistance amid volatility in the USD Index.
  • A pause in BoC’s policy tightening conveys that major central banks are near to the terminal rate.
  • More-than-projected contraction in the US Q4 GDP might accelerate recession fears.

Gold price (XAU/USD) is aiming to test the $1,950.00 resistance for the first time in the past nine months as the US Dollar Index has faced immense pressure. The precious metal displayed a vertical rally after dropping to near $1,920.00amid rising hopes that the Federal Reserve (Fed) has no other option than to announce a smaller interest rate hike ahead. Also, a pause announced in the policy tightening by the Bank of Canada (BoC) has conveyed a message that major central banks have reached to the terminal rate.

The US Dollar Index (DXY) has dropped to near seven-month low of around 101.20 and a downside break will trigger massive selling from the market participants. S&P managed to recover losses, portrayed optimism in the market and dips are being capitalized as a buying opportunity in the risk-perceived assets by the market participants. The 10-year US Treasury yields dropped to 3.44%.

For further guidance, investors will keep an eye on the release of the preliminary United States Gross Domestic Product (GDP) data for the fourth quarter of CY2022. As per the projections, the annualized GDP is seen lower at 2.6% vs. the prior release of 3.2%. An expression of a contraction in overall economic activities might accelerate recession fears on a broader basis.

Gold technical analysis

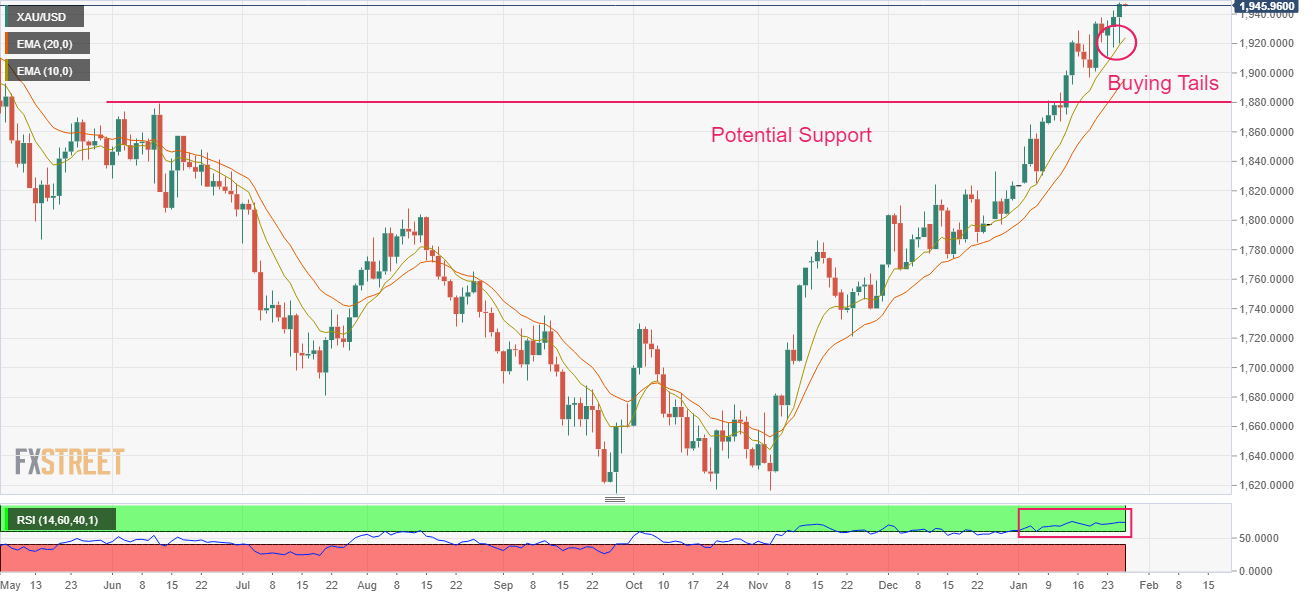
Gold price is in a strong uptrend forming higher highs and higher lows on a daily scale. The precious metal has witnessed three consecutive buying tails, which indicates that the market participants are buying the dips with immense interest. On a broader note, horizontal support plotted from June 13 high at $1,879.26 will be a cushion for the Gold price.

The 10-and 20-period Exponential Moving Averages (EMAs) at $1,924.74 and $1,895.26 respectively are aiming higher, which signals more upside ahead.

Also, the Relative Strength Index (RSI) (14) is oscillating in a bullish range of 60.00-80.00, which indicates that the bullish momentum is active.

Gold daily chart

XAU/USD

Overview
Today last price1945.96
Today Daily Change8.01
Today Daily Change %0.41
Today daily open1937.95
 
Trends
Daily SMA201878.11
Daily SMA501818.87
Daily SMA1001748.69
Daily SMA2001775.67
 
Levels
Previous Daily High1942.57
Previous Daily Low1917.19
Previous Weekly High1937.57
Previous Weekly Low1896.63
Previous Monthly High1833.38
Previous Monthly Low1765.89
Daily Fibonacci 38.2%1932.87
Daily Fibonacci 61.8%1926.89
Daily Pivot Point S11922.57
Daily Pivot Point S21907.19
Daily Pivot Point S31897.19
Daily Pivot Point R11947.95
Daily Pivot Point R21957.95
Daily Pivot Point R31973.33

Author

Sagar Dua

Sagar Dua

FXStreet

Sagar Dua is associated with the financial markets from his college days. Along with pursuing post-graduation in Commerce in 2014, he started his markets training with chart analysis.

More from Sagar Dua
Share:

Editor's Picks

AUD/USD falls to near 0.7100 after slipping below 50-day EMA

AUD/USD depreciates after registering minor gains in the previous day, trading around 0.7120 during the Asian hours. The technical analysis of the daily chart shows the pair consolidating sideways within a rectangle pattern, as neither bulls nor bears gain control. The AUD/USD pair is holding a slight bearish tone however as it sits beneath both the nine-day and 50-day EMAs.

160.00: USD/JPY back near intervention territory after upbeat US jobs report

US Nonfarm Payrolls beat expectations by a wide margin in May, with 172K jobs added. The US Dollar rebounds after the release, helping USD/JPY recover from its intraday lows. Warnings from Japanese authorities continue to limit upside potential near the 160.00 threshold.

Gold targets $4,300 amid stronger Dollar

Gold faces increasing selling interest and navigates the area of three-month lows near the $4,300 mark per troy ounce on Friday. The precious metal’s decline comes as traders assess the stronger-than-expected NFP, while the bid bias in the Greenback and higher US Treasury yields also collaborate with the retracement.

Cardano hits five-year low even as Hoskinson clarifies "break" isn't an exit

Cardano (ADA) price is down 10% at press time on Friday, extending losses over 30% so far this week amid Charles Hoskinson's clarification that "break" isn't an exit.

Week ahead – Fed countdown begins amid US inflation data and geopolitical risks

Fed Chair Warsh’s first meeting approaches as key US inflation data could reshape expectations. Oil prices remain elevated as US-Iran talks continue; tariffs also return to the spotlight. ECB is expected to hike; will it be a one-off move or is July live?

The US economy defies the rules: 100 days into the Oil shock and the recession signal is still missing

More than three months after the start of the Iran war and the resulting disruption to global energy markets, the US economy continues to display remarkable resilience. The conflict has triggered a sharp rise in Oil prices, reignited inflationary pressures and fueled widespread concerns about a potential economic slowdown.