|

Gold Price Forecast: XAU/USD establishes above $1,850 as DXY weakens, focus is on US Inflation

  • Gold price is holding itself above $1,850.00 as investors ignored uncertainty ahead of the US inflation.
  • The DXY has witnessed a decent sell-off which could drag the asset towards 102.00.
  • Higher inflation and upbeat NFP will compel the fed to feature a bumper rate hike.

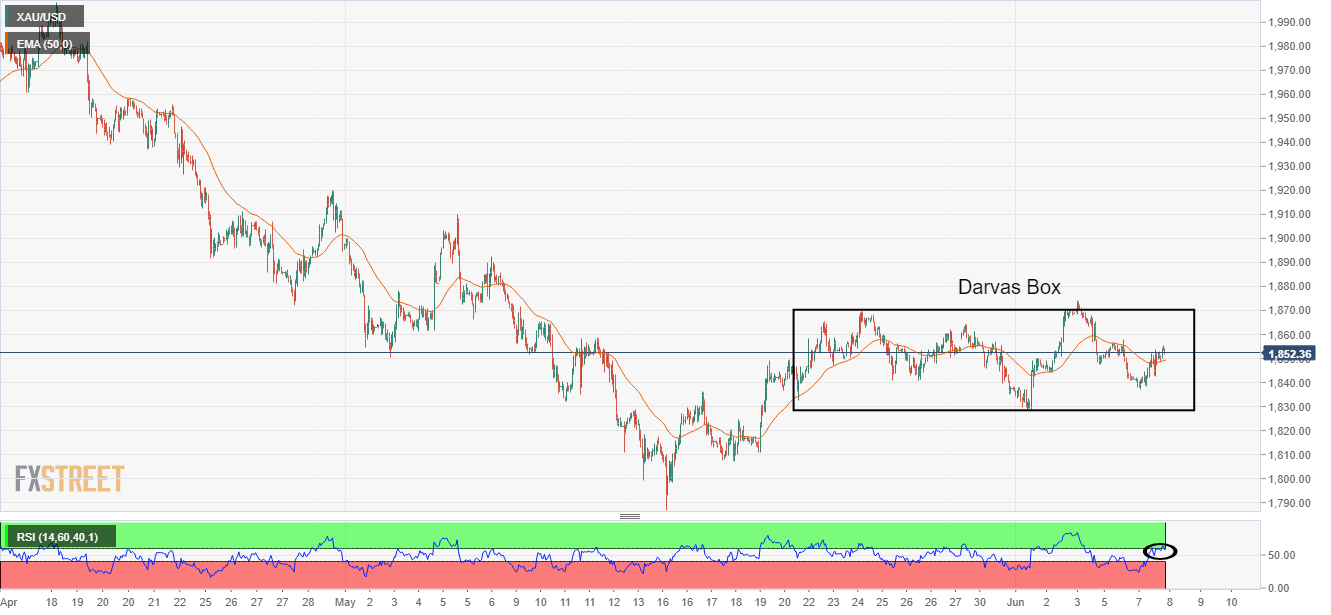
Gold price (XAU/USD) has displayed a minor correction after recording a high around $1,856.00 on Tuesday but is holding strongly above the crucial resistance of $1,850.00 as the US dollar index (DXY) has slipped sharply.  The precious metal has been advancing higher gradually after hitting a low of $1,837.06 and is expected to extend gains if the bright metal oversteps Tuesday’s high at $1,855.64.

The DXY surrendered the majority of its gains recorded on Tuesday after failing to cross the critical barricade of 102.83. A rebound in the risk-on impulse after investors ignored the uncertainty ahead of the US inflation strengthened the risk-perceived currencies and the precious metal. The US Consumer Price Index (CPI) is expected to remain unchanged at 8.3% while the core CPI that doesn’t include food and energy prices may slip to 5.9% vs. the prior print of 6.2%.  

The sustainability of the US inflation above 8% is going to put forward complications for the Federal Reserve (Fed). The Fed is going to dictate its monetary policy next week and elevated inflation along with the upbeat US Nonfarm Payrolls (NFP) will compel a rate hike decision.

Gold technical analysis

On an hourly scale, the gold price is oscillating in a wider range of $1,828.98-1,874.16 for a prolonged period. The precious metal is forming a Darvas Box chart pattern that signals a slippage in volatility followed by a breakout in the same. A 50-period Exponential Moving Average (EMA) at $1,849.74 is overlapping to the prices, which signals a rangebound move going forward.

Meanwhile, the Relative Strength Index (RSI) is struggling to enter into the bullish range of 60.00-80.00. An establishment in the same will strengthen the gold bulls.

Gold hourly chart
XAU/USD

Overview
Today last price1852.36
Today Daily Change10.93
Today Daily Change %0.59
Today daily open1841.43
 
Trends
Daily SMA201842.36
Daily SMA501889.93
Daily SMA1001889.04
Daily SMA2001841.44
 
Levels
Previous Daily High1857.99
Previous Daily Low1840.73
Previous Weekly High1874.16
Previous Weekly Low1828.55
Previous Monthly High1909.83
Previous Monthly Low1786.94
Daily Fibonacci 38.2%1847.32
Daily Fibonacci 61.8%1851.4
Daily Pivot Point S11835.44
Daily Pivot Point S21829.46
Daily Pivot Point S31818.18
Daily Pivot Point R11852.7
Daily Pivot Point R21863.98
Daily Pivot Point R31869.96

Author

Sagar Dua

Sagar Dua

FXStreet

Sagar Dua is associated with the financial markets from his college days. Along with pursuing post-graduation in Commerce in 2014, he started his markets training with chart analysis.


More from Sagar Dua
Share:

Editor's Picks

AUD/USD keeps range near mid-0.7100s as USD bulls await US CPI

AUD/USD steadies near mid-0.7100s in the Asian session on Friday, stalling the previous day's sharp decline to an over one-week low. The August PPI report reaffirmed Fed rate-hike bets and boosted the US Dollar on Thursday, which weighed heavily on the pair. However, hawkish RBA expectations limited losses for the Aussie as USD bulls now await the release of the US consumer inflation figures before placing fresh bets.

USD/JPY holds lower ground toward 154.00; looks to US CPI

USD/JPY holds lower ground toward 154.00 in the Asian session on Friday after hot Japanese PPI data bolster a more hawkish BoJ repricing and provide fresh impetus to the Japanese Yen. However, the downside appears capped as the US Dollar preserves overnight gains ahead of the latest US consumer inflation data.

Gold: Gains remain capped by $4,400

Gold regains composure and trades with decent gains on Friday, managing to refocus attention on the $4,440 mark per ounce troy. Therefore, the precious metal reverses Thursday’s decline as the US Dollar alternates gains with losses at the end of the week.

Ripple Price Forecast: XRP extends decline as returning ETF inflows fail to lift outlook
Ripple (XRP) falls below $1.33 on Friday, marking the third consecutive day of declines. The token continues to track the broader cryptocurrency market downturn, with investors closely monitoring heightened macroeconomic uncertainty ahead of the United States (US) Consumer Price Index (CPI) release and next week’s Federal Reserve (Fed) monetary policy decision.
Weekly focus – The hawks set the tone
Risky assets came under pressure this week as energy prices kept creeping higher and the ECB surprised the markets with a hawkish tone. The price of Brent crude touched USD 110 per barrel on Thursday night, highest since mid-May, as news emerged that the Yemeni Houthis had reached control of key port cities and islands near the Bab el-Mandeb strait.
Venezuela’s 65-billion-barrel Oil deal could reshape America’s inflation fight
The United States (US) has secured unprecedented access to part of Venezuela’s vast Oil reserves. The timing is particularly significant as the war with Iran is disrupting Middle Eastern supplies, keeping energy prices elevated and reviving concerns about inflation.















