Gold Price Forecast: XAU/USD drops towards $1,980 as hawkish Fed bias, sour sentiment favors US Dollar


  • Gold price takes offers to reverses the previous day’s corrective bounce.
  • Geopolitical fears surrounding China, Russia joins hawkish Fed bets and fears of US government default to roil the risk appetite.
  • Risk-aversion underpins US Dollar and yields while weighing on XAU/USD ahead Fed Beige Book.

Gold price (XAU/USD) bears the burden of the US Dollar rebound as it drops back below $2,000, around $1,990 after renewing its intraday low with $1,987 mark during early Wednesday in Europe.

In doing so, the bright metal takes clues from the risk-off mood, mainly linked to Russia and China, as well as the US debt payment default fears. Furthermore, upbeat US Treasury bond yields and hawkish Federal Reserve (Fed) talks also underpin US Dollar’s rebound and weigh on the XAU/USD price.

UK’s warning that Russian hackers targeting Western critical infrastructure and the fears surrounding the US-China tension about Taiwan, due to the US House China Committee’s discussion about the Taiwan invasion scenario, weigh on the risk profile. On the same line could be the Reuters’ news suggesting that US consumers are starting to fall behind on their credit card and loan payments as the economy softens.

Furthermore, the likely drag on the US debt ceiling decision due to US President Joe Biden’s hesitance in lifting debt limits. Additionally, Bloomberg released news suggesting China’s role in the Russia-Ukraine war, which in turn adds strength to the risk-off mood and propels the US Dollar, which in turn drowns the Gold price.

On a different page, the markets are almost certain of 0.25% Fed rate hike in May and the same joins the recently easing odds favoring the rate cut in 2023 to portray the hawkish bias about the US central bank. Behind the moves are Friday’s US Consumer-centric figures and Monday’s US activity data, as well as the latest upbeat comments from St. Louis Federal Reserve President James Bullard, Richmond Fed President Thomas Barkin and Atlanta Fed President Raphael W. Bostic. However, recently downbeat US housing data prod the Fed hawks and put a floor under the Gold price.

Amid these plays, the S&P 500 Futures dropped 0.30% intraday while reversing from the highest levels since early February whereas the US two-year Treasury bond yields jump to a fresh high in one month. Further, the US 10-year bond coupons also rise to 3.61% and allow the US Dollar Index (DXY) to print 0.20% intraday gains while poking 102.00 level.

Moving on, Gold traders should rely on the risk catalysts, mainly surrounding geopolitics and the US debt ceiling, for immediate directions as today’s economic calendar appears mostly empty with only Fed Beige Book on the watch. That said, the likely increase in the risk-aversion and hawkish Fed bets could weigh on the XAU/USD prices.

Technical analysis

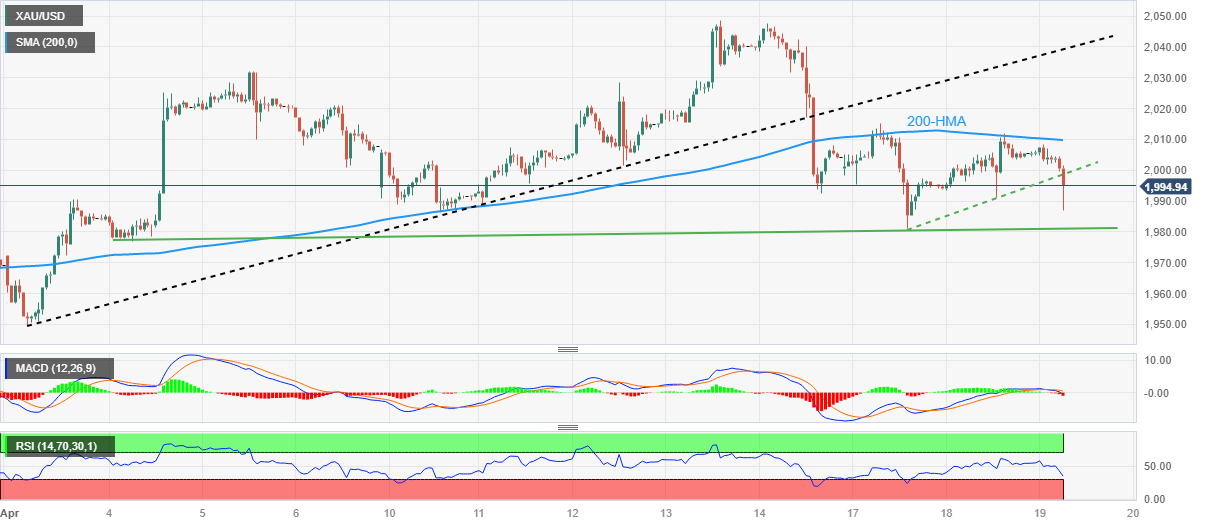
With the Gold price’s latest weakness, it marks another U-turn from the 200-Hour Moving Average (HMA), which in turn joins the bearish MACD signals to direct the XAU/USD bears toward a two-week-old ascending support line near $1,980.

However, the RSI (14) line is oversold and hence the quote’s further downside past $1,980 appears less likely, which if happens could direct the XAU/USD price in the direction of the monthly low of around $1,949.

Meanwhile, a two-day-old ascending trend line, previous support near $1,999, restrict the immediate rebound of the Gold price.

Following that, the 200-HMA level of around $2,010 can challenge the XAU/USD buyers.

Above all, the Gold price remains on the bear’s radar unless the quote stays below the previous support line from April 03, close to $2,040 at the latest.

Gold price: Hourly chart

Trend: Further downside expected

Additional important levels

Overview
Today last price 1992.15
Today Daily Change -13.27
Today Daily Change % -0.66%
Today daily open 2005.42
 
Trends
Daily SMA20 1990.71
Daily SMA50 1912.38
Daily SMA100 1880.5
Daily SMA200 1796.32
 
Levels
Previous Daily High 2011.9
Previous Daily Low 1991.32
Previous Weekly High 2048.75
Previous Weekly Low 1986.28
Previous Monthly High 2009.88
Previous Monthly Low 1809.46
Daily Fibonacci 38.2% 2004.04
Daily Fibonacci 61.8% 1999.18
Daily Pivot Point S1 1993.86
Daily Pivot Point S2 1982.3
Daily Pivot Point S3 1973.28
Daily Pivot Point R1 2014.44
Daily Pivot Point R2 2023.46
Daily Pivot Point R3 2035.02


Share: Feed news

Information on these pages contains forward-looking statements that involve risks and uncertainties. Markets and instruments profiled on this page are for informational purposes only and should not in any way come across as a recommendation to buy or sell in these assets. You should do your own thorough research before making any investment decisions. FXStreet does not in any way guarantee that this information is free from mistakes, errors, or material misstatements. It also does not guarantee that this information is of a timely nature. Investing in Open Markets involves a great deal of risk, including the loss of all or a portion of your investment, as well as emotional distress. All risks, losses and costs associated with investing, including total loss of principal, are your responsibility. The views and opinions expressed in this article are those of the authors and do not necessarily reflect the official policy or position of FXStreet nor its advertisers. The author will not be held responsible for information that is found at the end of links posted on this page.

If not otherwise explicitly mentioned in the body of the article, at the time of writing, the author has no position in any stock mentioned in this article and no business relationship with any company mentioned. The author has not received compensation for writing this article, other than from FXStreet.

FXStreet and the author do not provide personalized recommendations. The author makes no representations as to the accuracy, completeness, or suitability of this information. FXStreet and the author will not be liable for any errors, omissions or any losses, injuries or damages arising from this information and its display or use. Errors and omissions excepted.

The author and FXStreet are not registered investment advisors and nothing in this article is intended to be investment advice.

Recommended content


Recommended content

Editors’ Picks

EUR/USD drops to near 1.0850, further support at nine-day EMA

EUR/USD drops to near 1.0850, further support at nine-day EMA

EUR/USD continues to lose ground, trading around 1.0860 during the Asian hours on Friday. From a technical perspective on a daily chart, analysis indicates a sideways trend for the pair as it continues to lie within the symmetrical triangle.

EUR/USD News

GBP/USD posts modest gains above 1.2650, focus on the Fedspeak

GBP/USD posts modest gains above 1.2650, focus on the Fedspeak

The GBP/USD pair posts modest gains near 1.2670 during the Asian session on Friday. Meanwhile, the USD Index recovers some lost ground after retracing to multi-week lows near 104.00 in the previous session.

GBP/USD News

Gold price loses momentum, with Fed speakers in focus

Gold price loses momentum, with Fed speakers in focus

Gold price trades with a bearish bias on Friday after retreating from the nearly $2,400 barrier. The bullish move of precious metals in the previous sessions was bolstered by the softer-than-expected US inflation data in April, which triggered hope for rate cuts from the US Federal Reserve.

Gold News

LINK price jumps 10% as Chainlink races toward tokenization of funds

LINK price jumps 10% as Chainlink races toward tokenization of funds

Chainlink price has remained range-bound for a while, stuck between the $16.00 roadblock to the upside and $13.08 to the downside. However, in light of recent revelations, the token may have further upside potential.

Read more

Fed speak tempers rate cut expectations

Fed speak tempers rate cut expectations

The biggest takeaway into Friday is the latest round of Fed speak. These Fed officials reiterated their stance rates should be kept restrictive for a longer period of time until there is more clear evidence inflation is heading back towards the 2% target.  

Read more

Forex MAJORS

Cryptocurrencies

Signatures