|

Gold Price Forecast: XAU/USD drops post refreshing all-time-high near $2,080 as Fed signals a pause ahead

  • Gold price has displayed some correction after posting a fresh YTD high at $2,079.76.
  • The Fed announced that further monetary policy decisions would be highly dependent on incoming data.
  • Investors are worried that US labor market conditions are still tight and could accelerate persistent inflation.

Gold price (XAU/USD) has witnessed a steep fall after printing a fresh year-to-date (YTD) high placed at $2,067.00 in the early Asian session. The yellow metal has attracted significant offers as the US Dollar Index (DXY) has attempted a recovery. Earlier, the precious metal gained immense strength as the Federal Reserve (Fed) signaled a pause in the policy-tightening spell from June after hiking interest rates by 25 basis points (bps) to 5.00-5.25%.

Fed chair Jerome Powell announced that further monetary policy decisions would be highly dependent on incoming data. The Fed is moving from its prior language of ‘some additional policy firmly’ to ‘closely monitoring incoming information’ suggesting that monetary policy is restrictive enough for now to curb sticky inflation.

Meanwhile, S&P500 futures settled Wednesday’s session on a bearish note after surrendering stellar gains amid uncertainty over the further path of arresting sticky inflation, portraying a risk-aversion theme.

The US Dollar Index (DXY) is showing signs of recovery after a steep correction to near 101.26. Investors are worried that the United States labor market conditions are still tight and could accelerate persistent inflation.

On Wednesday, the US Automatic Data Processing (ADP) agency showed an addition of fresh payrolls at 296K vs. the estimates of 150K and the former release of 145K. If incoming information continues to remain expansionary in this way, the Fed won’t have another option than to hike interest rates further.

Gold technical analysis

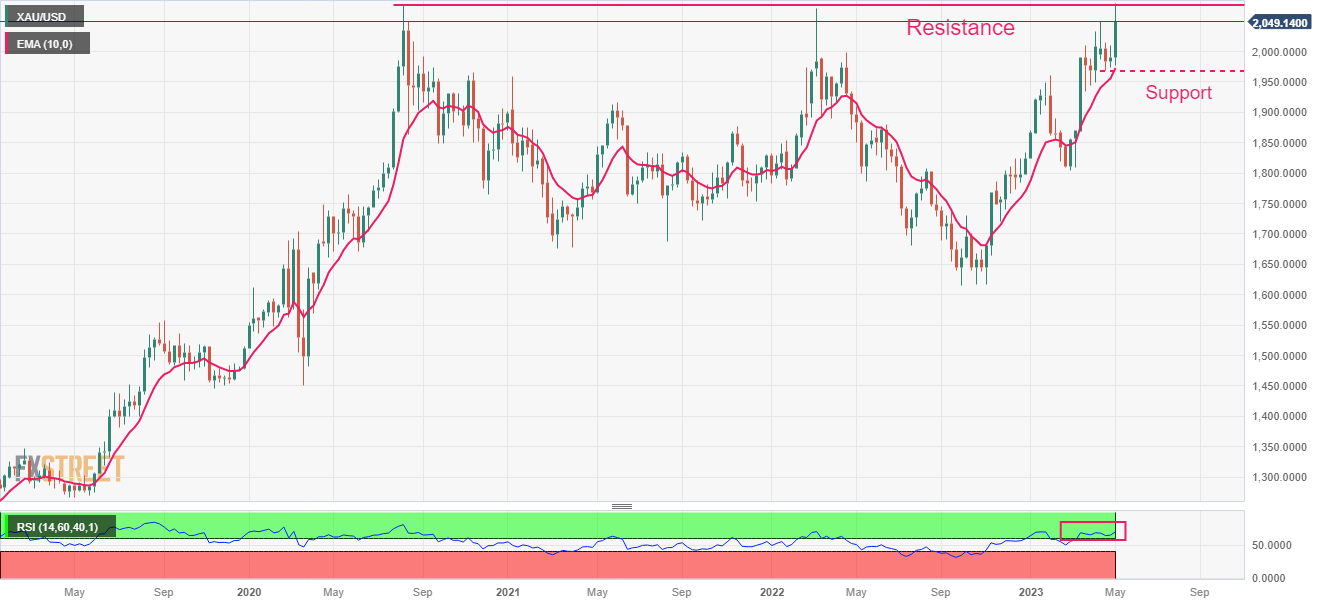
Gold price has sensed selling pressure after printing a fresh YTD at $2,079.76 as profit-booking kicked in. The precious metal has conquered its prior resistance plotted from 07 August 2020 high at $2,075.22. Intermediate support is placed from April 21 low at $1,969.29.

The 10-period Exponential Moving Average (EMA) at $1,973.73 is providing cushion to the Gold bulls.

Meanwhile, the Relative Strength Index (RSI) (14) is oscillating in the bullish range of 60.00-80.00, indicating a continuation of the upside momentum.

Gold weekly chart

XAU/USD

Overview
Today last price2050.44
Today Daily Change33.77
Today Daily Change %1.67
Today daily open2016.67
 
Trends
Daily SMA202001.95
Daily SMA501940.31
Daily SMA1001901.75
Daily SMA2001810.17
 
Levels
Previous Daily High2019.43
Previous Daily Low1978.51
Previous Weekly High2009.41
Previous Weekly Low1974.13
Previous Monthly High2048.75
Previous Monthly Low1949.83
Daily Fibonacci 38.2%2003.8
Daily Fibonacci 61.8%1994.14
Daily Pivot Point S11990.31
Daily Pivot Point S21963.95
Daily Pivot Point S31949.39
Daily Pivot Point R12031.23
Daily Pivot Point R22045.79
Daily Pivot Point R32072.15

Author

Sagar Dua

Sagar Dua

FXStreet

Sagar Dua is associated with the financial markets from his college days. Along with pursuing post-graduation in Commerce in 2014, he started his markets training with chart analysis.

More from Sagar Dua
Share:

Editor's Picks

AUD/USD eyes 0.7150 barrier nine-day EMA

AUD/USD inches higher after registering modest losses in the previous day, trading around 0.7130 during the Asian hours. The technical analysis of the daily chart indicates that the pair is moving sideways within the rectangle pattern, suggesting a consolidation as neither the bulls nor the bears have enough momentum to take control of the market.

USD/JPY trades below 160.00 intervention threshold; bullish bias intact

The USD/JPY pair attracts some sellers during the Asian session amid fears that authorities will step in again to prop up the Japanese Yen. Furthermore, the Israel-Lebanon truce prompts some profit-taking around the US Dollar and exerts downward pressure on the currency pair.

Gold defends 200-day SMA, rises toward $4,500

Gold is attempting a tepid recovery toward $4,500 on Thursday, as renewed optimism in the Mideast geopolitical front calms market nerves. This cautious optimism across Asian markets weighs on Oil prices, and diminishes the US Dollar’s safe-haven appeal, helping Gold stage a decent comeback from the weekly low of $4,424.


Hyperliquid: ETF demand, capital rotation fuel HYPE rally as Bitcoin melts

Hyperliquid price sustains an upward trend near its all-time high of $75.76 on Thursday after posting 80% gains in May, while Bitcoin (BTC) retraces below $65,000, triggering a market-wide panic.

Kevin Warsh takes the Fed helm: What it means for the US Dollar
The Federal Reserve moves away from the highly predictable "forward guidance" model of the Jerome Powell era to a new “Kevin Warsh environment”, characterized by less communication, more policy surprises, and an increased focus on the Fed's complex balance sheet.
Recession on paper: What really moves the Canadian Loonie now?

Statistics Canada handed the headline writers a gift and the analysts a headache. Real GDP shrank 0.1% on an annualized basis in the first quarter, and with the fourth quarter of 2025 revised down to a 1.0% contraction, that is two negative quarters in a row, the textbook definition of a technical recession and Canada's first since the pandemic.