Gold Price Forecast: XAU/USD retreats from a two-week high near $1,840
- Gold consolidates the heaviest daily and weekly gains since early May.
- Market sentiment sours as virus concern escalate, progress over US stimulus ignored.
- US dollar shrugs off Treasury yield pullback to rebound from monthly low ahead of Core PCE Price Index.
- Gold Weekly Forecast: XAU/USD bears await break below 100-day SMA at $1,796

Update: Gold prices edge lower on Friday, after testing a two-week high near $1840 on Thursday. The prices were gained for the third straight session on weaker US Dollar and signal by the US Fed that taper could be delayed as there is still a long way to substantial progress. The US central bank acknowledged the fact about the eventual withdrawal of pandemic-era monetary policy support. The optimism surrounding the increased demand in India in the second half of the year also added to the gains. however, the rebound in the US dollar in the Asian session weighs on the upside momentum of the precious metal. The higher USD valuations make gold expansive for other currencies holders. The US Treasury yields edge lower at 1.25% with 1.32% losses, which could fuel the further gold rally in the near future.
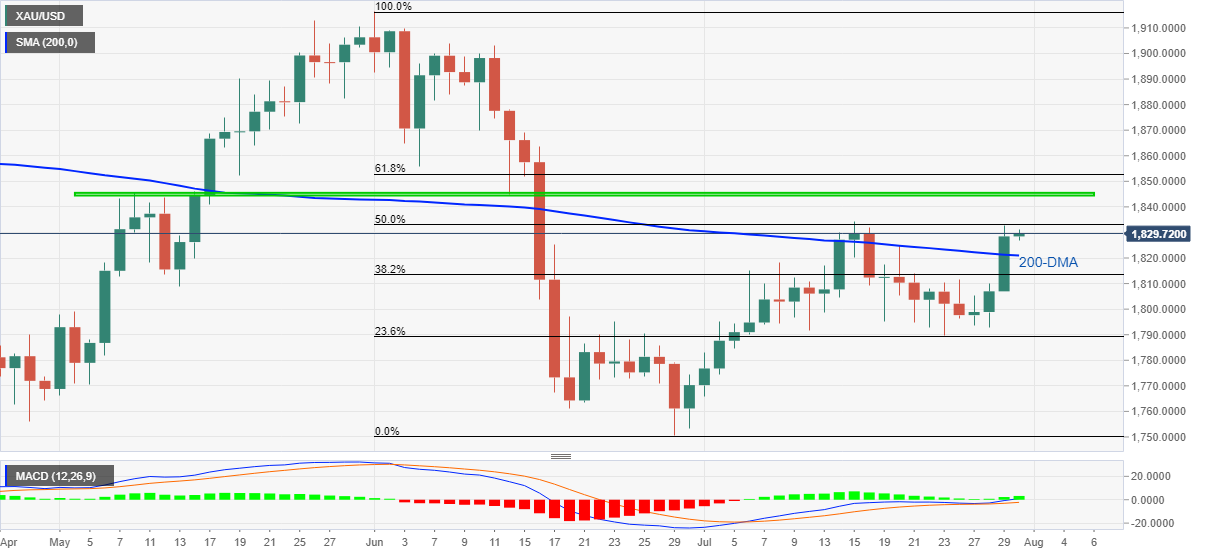
Gold (XAU/USD) stays defensive around $1,830, sidelined of late, amid Friday’s Asian session. The yellow metal crossed 200-DMA for the first time since mid-July the previous day on the market’s risk-on mood. However, the escalating Delta covid variant fears and wait of the Fed’s preferred inflation gauge challenge buyers afterward.
Australia’s New South Wales (NSW) posted softer-than-previous daily infections, 172 versus 240, but the US marked the biggest one-day increase in cases since February. Further, Japan witnesses above 10,000 cases for the first time and stays ready to take more prefectures under virus-led emergency whereas the UK’s daily count of the COVID-19 eases but the seven-day average jumps 22%.
It should be noted that the US inflation expectations recently jumped to the multi-day high and exerts additional pressure on the Fed to tame the reflation fears. Even so, downbeat Q2 GDP data and cooling house market figures seem to defend Jerome Powell and Company. Though, today’s US Core Personal Consumption Expenditure Price Index for June, expected 3.7% YoY versus 3.4% prior, will be the key to follow as it becomes the US Federal Reserve’s (Fed) key inflation barometer.
Elsewhere, Reuters conveyed an upbeat progress report for US President Joe Biden’s infrastructure spending proposal. The news said, “The U.S. Senate on Thursday prepared to tackle the details of a $1 trillion bipartisan infrastructure bill backed by President Joe Biden, with the possibility of weekend work looming after lawmakers agreed to advance the measure.”
Amid these plays, the US Dollar Index (DXY) snaps a four-day downtrend to rebound from the monthly low while benefiting from the risk-off mood. However, the same weigh on the US 10-year Treasury yields, down two basis points (bps) to 1.249%, as well as stock futures by the press time.
Other than the US data, gold traders will also pay close attention to the risk catalysts as the Fed has already spoken for itself.
Read: US Core Personal Consumption Expenditure Price Index June Preview: Bad will not be bad enough
Technical analysis
Despite providing a daily close beyond 200-DMA, backed by bullish MACD, gold prices failed to refresh monthly top, not to forget staying below 50% Fibonacci retracement of June’s fall.
Given the metal’s previous pullback from the key $1,835 hurdle, coupled with the pre-US data cautious, gold traders should wait for a clear upside break of the stated resistance before targeting the $1,845 area comprising multiple levels marked since early May.
It’s worth mentioning that the pullback moves also remain doubtful until declining back below the 200-DMA level of $1,820.
Following that, $1,800 and 23.6% Fibonacci retracement near $1,790 should return to the chart.
Gold: Daily chart
Trend: Pullback expected
Author

Anil Panchal
FXStreet
Anil Panchal has nearly 15 years of experience in tracking financial markets. With a keen interest in macroeconomics, Anil aptly tracks global news/updates and stays well-informed about the global financial moves and their implications.