|

Gold Price Forecast: XAU/USD corrects from $1,780, upside remains favored on weaker DXY

  • Gold price is testing the upside break of the consolidation formed in a $1,764.45-1,775.35 range.
  • A slippage in US ISM New Orders Index data indicates the downside risk of demand ahead.
  • The US NFP is likely to slip to 250k from the prior release of 372k.

Gold price (XAU/USD) has corrected t near $1,774.65 after printing a high of $1,780.58 in the early Tokyo session. The precious metal is likely to rebound again as an upside break of consolidation is followed by a low-volume test of the breakout. Earlier, the bright metal displayed an upside break of the consolidation formed in a $1,764.45-1,775.35 range.

Meanwhile, the US dollar index (DXY) has found a modest rebound after refreshing the three-week low at 105.05 at the open. The DXY has shifted into a negative trajectory as forward demand by retailers and producers has trimmed significantly. The US agency reported a vulnerable US Institute of Supply Management (ISM) Manufacturing New Orders Index data on Monday.

The economic data indicates forward demand by the retailers and producers. The data remained lower than the estimates of 52 and the prior print of 49.2 at 48. A meaningful trim in the demand forecast indicator resulted in a steep fall in the DXY.

Going forward, investors’ entire focus will remain on the mega event of the US Nonfarm Payrolls (NFP), which is due on Friday. As per the market consensus, the US economy has generated 250k jobs in July lower than June’s print of 372k. This will strengthen the gold price against the greenback.

Gold technical analysis

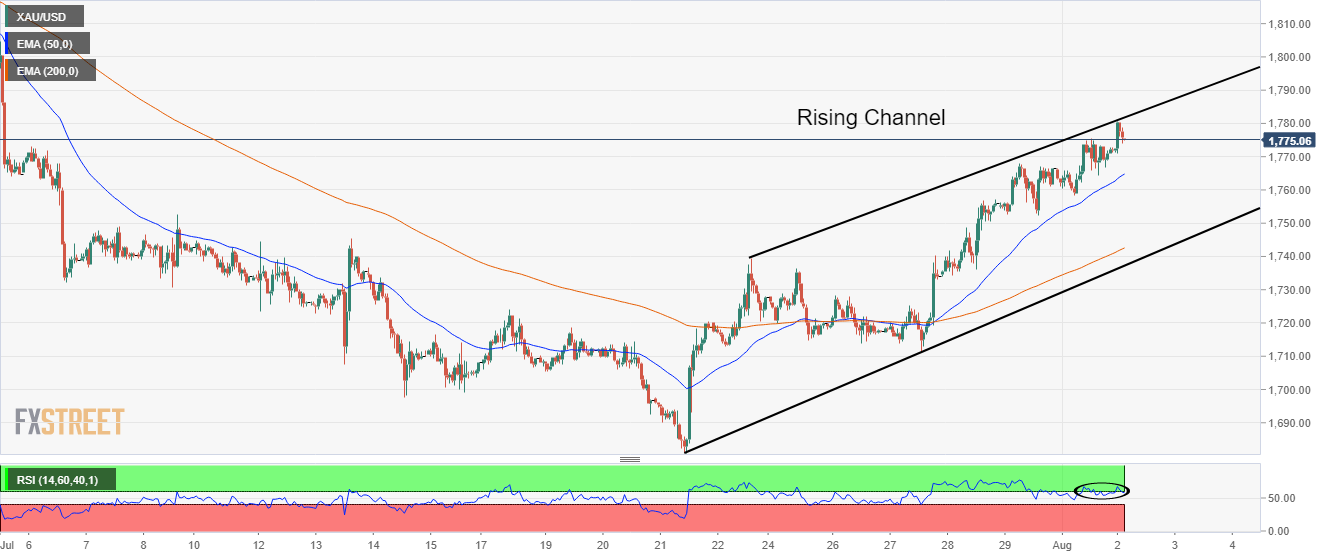
A rising channel formation by the gold prices on an hourly scale advocates the continuation of an upside move. The upper portion of the above-mentioned chart pattern is placed from July 22 high at $1,739.37 while the lower portion is plotted from July 21 low at $1,681.87.

Advancing 50-and 200-Exponential Moving Averages (EMAs) at $1,765.40 and $1,742.85 respectively adds to the upside filters.

Meanwhile, the Relative Strength Index (RSI) (14) is attempting to reclaim 60.00 levels. An occurrence of the same will warrant a fresh bullish impulsive wave.

Gold hourly chart  

XAU/USD

Overview
Today last price1774.04
Today Daily Change1.84
Today Daily Change %0.10
Today daily open1772.2
 
Trends
Daily SMA201731.5
Daily SMA501795.61
Daily SMA1001851.3
Daily SMA2001842.41
 
Levels
Previous Daily High1775.44
Previous Daily Low1758.45
Previous Weekly High1768.04
Previous Weekly Low1711.55
Previous Monthly High1814.37
Previous Monthly Low1680.91
Daily Fibonacci 38.2%1768.95
Daily Fibonacci 61.8%1764.94
Daily Pivot Point S11761.95
Daily Pivot Point S21751.71
Daily Pivot Point S31744.96
Daily Pivot Point R11778.94
Daily Pivot Point R21785.69
Daily Pivot Point R31795.93

Author

Sagar Dua

Sagar Dua

FXStreet

Sagar Dua is associated with the financial markets from his college days. Along with pursuing post-graduation in Commerce in 2014, he started his markets training with chart analysis.

More from Sagar Dua
Share:

Markets move fast. We move first.

Orange Juice Newsletter brings you expert driven insights - not headlines. Every day on your inbox.

By subscribing you agree to our Terms and conditions.

Editor's Picks

EUR/USD edges above 1.1750 due to ECB-Fed policy divergence

EUR/USD has recovered its recent losses registered in the previous session, trading around 1.1760 during the Asian hours on Friday. Traders will likely observe Germany’s Manufacturing Purchasing Managers’ Index data later in the day.

GBP/USD gathers strength above 1.3450 on Fed rate cut bets, BoE's gradual policy path

The GBP/USD pair gathers strength to around 1.3480 during the early Asian session on Friday. Expectations of the US Federal Reserve rate cuts this year weigh on the US Dollar against the Pound Sterling. Philadelphia Fed President Anna Paulson is set to speak later on the weekend. 

Gold climbs to near $4,350 on Fed rate cut bets, geopolitical risks

Gold price rises to near $4,345 during the early Asian session on Friday. Gold finished 2025 with a significant rally, achieving an annual gain of around 65%, its biggest annual gain since 1979. The rally of the precious metal is bolstered by the prospect of further US interest rate cuts in 2026 and safe-haven flows.

Bitcoin trades in compression as 2026 begins with structure still unresolved

BTC/USD remains locked in a two-way structure, with micro supply-and-demand levels guiding early-year price behaviour.

Economic outlook 2026-2027 in advanced countries: Solidity test

After a year marked by global economic resilience and ending on a note of optimism, 2026 looks promising and could be a year of solid economic performance. In our baseline scenario, we expect most of the supportive factors at work in 2025 to continue to play a role in 2026.

Crypto market outlook for 2026

Year 2025 was volatile, as crypto often is.  Among positive catalysts were favourable regulatory changes in the U.S., rise of Digital Asset Treasuries (DAT), adoption of AI and tokenization of Real-World-Assets (RWA).