Gold Price Forecast: XAU/USD continues to juggle above $1960 as investors await US PCE Price Index
- Gold price is oscillating above $1,960.00 ahead of US PCE Price Index for fresh impetus.
- S&P500 recorded a stellar rally on Wednesday as fears of a global banking crisis receded, portraying a risk-on mood.
- Fed Barr assured investors that the failure of a couple of lenders is unable to lead to a widespread contagion.

Gold price (XAU/USD) is displaying topsy-turvy moves in a $12 range above 1,960.00 in the early Asian session. The precious metal is defending the $1,960.00 support despite easing global banking jitters, which has trimmed the appeal for Gold as a safe-haven asset.
The asset is unable to find a decisive move as investors are awaiting the release of the United States the core Personal Consumption Expenditure (PCE) Price Index (Feb) data will be of significant importance. As per the consensus, monthly core PCE would accelerate by 0.4%, lower than the former expansion of 0.6%. The annual figure is expected to remain steady at 4.7%.
S&P500 recorded a stellar rally on Wednesday as fears of a global banking crisis receded, portraying a firmer risk appetite of the market participants. The commentary from Federal Reserve (Fed) Vice Chair for Supervision Michael Barr told Senate Banking Committee that the United States banking system is ‘sound and resilient’. He assured investors that the failure of a couple of lenders is unable to lead to a widespread contagion.
The US Dollar Index (DXY) has shown some gradual correction to near 102.70 after a solid recovery on hopes that ebbing global banking jitters would allow the Fed to continue its policy-tightening spell. The demand for US government bonds remained choppy as fears of a banking crisis are ebbing, which left 10-year US Treasury yields steady at around 3.56%.
Gold technical analysis
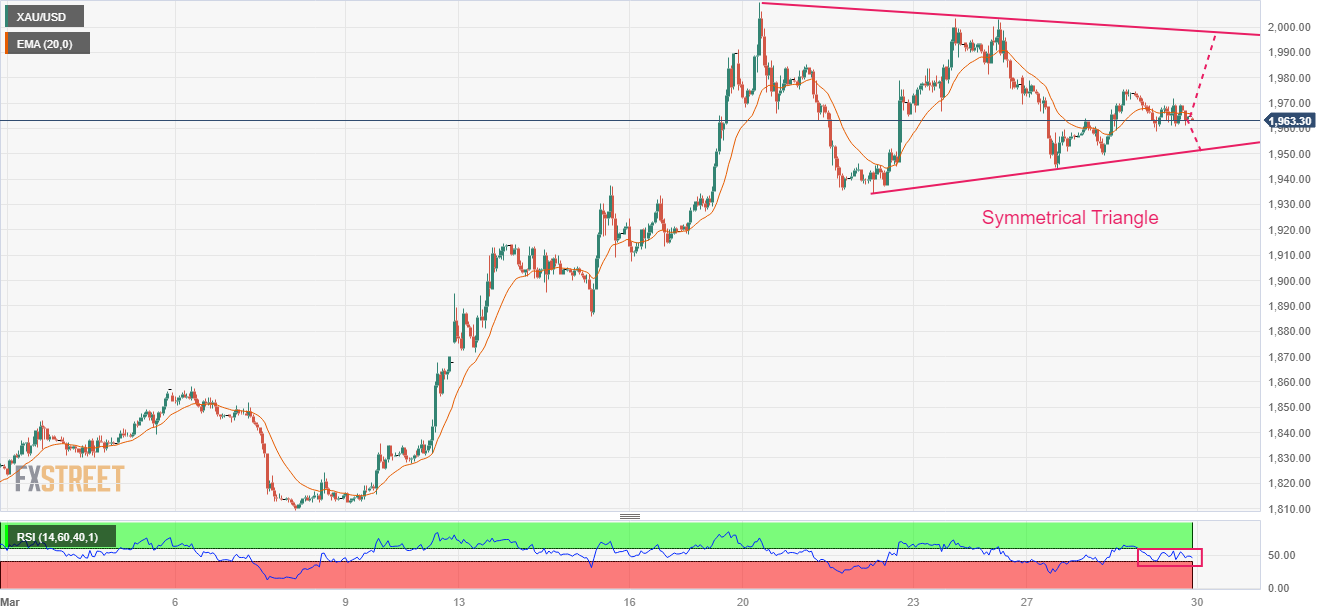
Gold price is auctioning in a Symmetrical Triangle chart pattern on a two-hour scale. The upward-sloping trendline of the chart pattern is plotted from March 22 low at $1,934.34 while the downward-sloping trendline is placed from March 20 high at $2,009.88. Any side break of the Symmetrical Triangle, a volatility contraction pattern, will result in wider ticks and heavy volume.
The 20-period Exponential Moving Average (EMA) at $1,965.00 overlaps with the asset price, indicating a rangebound performance ahead.
Meanwhile, the Relative Strength Index (RSI) (14) is oscillating in the 40.00-60.00 range, which indicates that investors are awaiting a fresh trigger for further action.
Gold hourly chart
Author

Sagar Dua
FXStreet
Sagar Dua is associated with the financial markets from his college days. Along with pursuing post-graduation in Commerce in 2014, he started his markets training with chart analysis.


