Gold Price Forecast: XAU/USD bears target $1739 if $1749 caves in – Confluence Detector
- Gold price supported at $1750, despite a rebound in the Treasury yields.
- USD retreat, risk-off mood put a floor under gold price, for now.
- Gold appears ‘sell on bounce’ ahead of all-important NFP

Gold price has kicked off the NFP week on the wrong footing, challenging the $1750 psychological barrier amid a rebound in the US Treasury yields across the curve. Rising inflation expectations calls for a sooner than expected monetary policy tightening by the Fed, lifting the rates on the markets. Meanwhile, the broader market sentiment remains tepid amid China Evergrande uncertainty and fresh US-Sino trade jitters limiting the downside in gold price. The US dollar retreat also helps gold price, although light trading could exaggerate moves in the bright metal.
Read: Gold Price Forecast: Upside potential appears limited above $1750, US NFP awaited
Gold Price: Key levels to watch
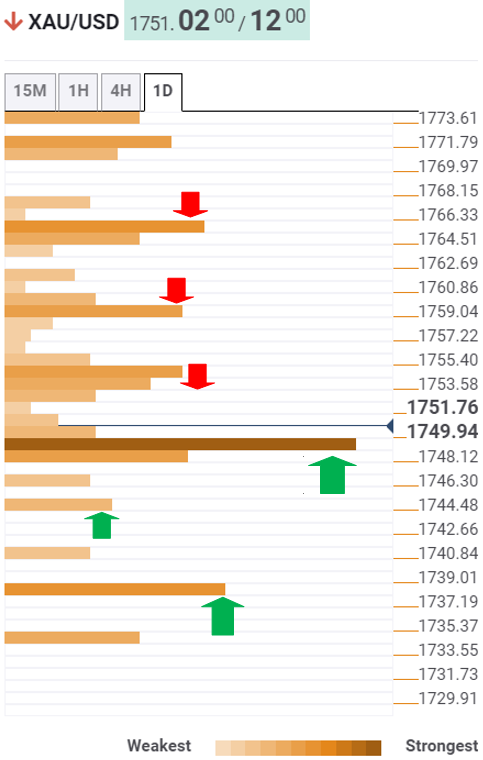
According to the Technical Confluences Detector, gold is testing bids at critical support at $1749, which is the convergence of the previous low one-hour, Fibonacci 23.6% one-month and Fibonacci 38.2% one-week.
On a sustained move below the latter, the intersection of the SMA100 one-hour and pivot point one-day S2 and SMA5 one-day at $1744 could be tested.
$1739 will be the level to beat for gold bears, which is the confluence of the pivot point one-day S3 and Fibonacci 61.8% one-week.
On the flip side, strong resistance appears around $1754, where the Fibonacci 23.6% one-week coincides with the SMA50 one-hour and SMA10 one-day.
The next upside target is seen at $1759, the Fibonacci 38.2% one-day. The previous day’s highs at $1764 could then challenge the recovery momentum.
Here is how it looks on the tool
About Technical Confluences Detector
The TCD (Technical Confluences Detector) is a tool to locate and point out those price levels where there is a congestion of indicators, moving averages, Fibonacci levels, Pivot Points, etc. If you are a short-term trader, you will find entry points for counter-trend strategies and hunt a few points at a time. If you are a medium-to-long-term trader, this tool will allow you to know in advance the price levels where a medium-to-long-term trend may stop and rest, where to unwind positions, or where to increase your position size.
Author

Dhwani Mehta
FXStreet
Residing in Mumbai (India), Dhwani is a Senior Analyst and Manager of the Asian session at FXStreet. She has over 10 years of experience in analyzing and covering the global financial markets, with specialization in Forex and commodities markets.


