Gold Price Forecast: XAU/USD pressured into early Asia, US dollar bouncing back
- The yellow-metal remains pressured ahead of the Federal Reserve May meeting.
- A downbeat market mood, courtesy of China’s Covid-19 struggling and weak PMIs reported, threatens to derail the world’s second-largest economy.
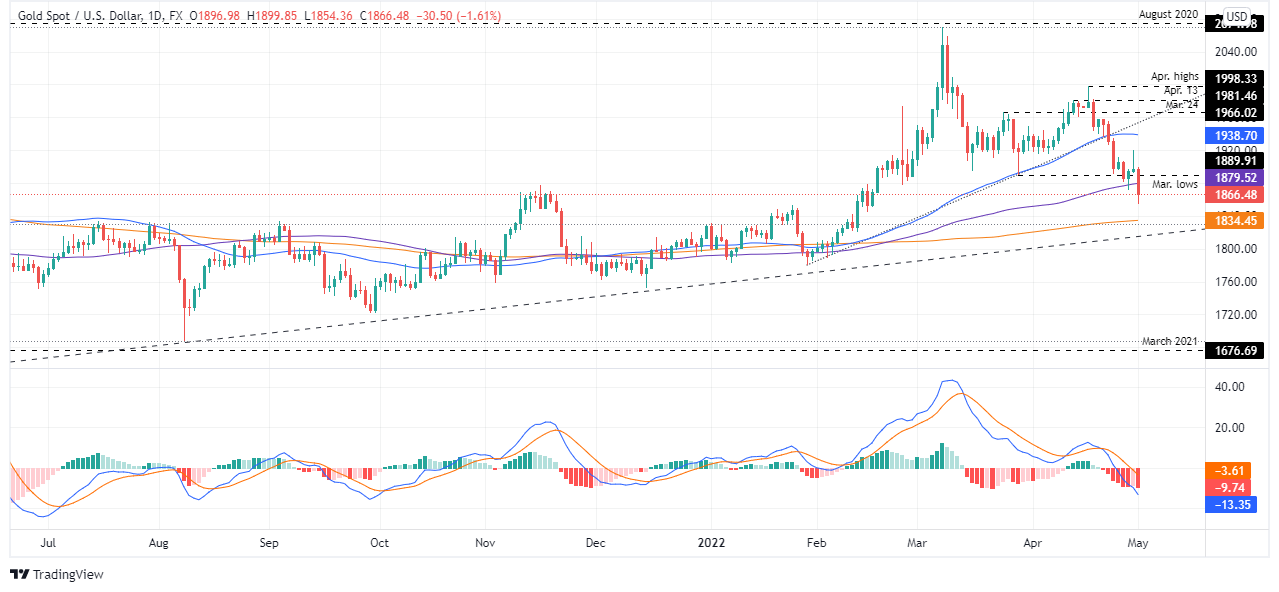
- Gold Price Forecast (XAU/USD): Neutral biased, though a daily close below the 100-DMA might put the 200-DMA in play.

Update: Gold spot (XAU/USD) is down some 1.8% at the time of writing on a day where the US dollar bounced back to life and US 10-year yields breached 3% for the first time since 2018. The bears are all over the currency space as investors get set for a hawkish outcome at the Federal Reserve meeting this week.
The potential for the US central bank to adopt an even more hawkish tone than many expect is underpinning the greenback at the start of the week. The Fed is expected to hike rates 50 bp to 1.0% Wednesday. While there will be no new forecasts until the June 14-15 FOMC meeting, another 50 bp hike is widely expected then also. In fact, as analysts at Brown Brothers Harriman note, WIRP suggests nearly 50% odds of a 75 bp hike then.
''Looking further out,'' the analysts said, ''the swaps market is now pricing in 300 bp of tightening over the next 12 months that would see the Fed Funds rate peak near 3.5%. Because of the media blackout, there are no Fed speakers until Chair Jerome Powell’s post-decision press conference Wednesday afternoon.''
Risk-aversion ahead of the Fed meeting boosts the greenback
The market sentiment remains dampened as the US central bank takes center stage in a busy week in the US economic docket. Alongside the Fed's May meeting, the US ISM Manufacturing PMI for April was released earlier as Wall Street opened, with the reading showing that manufacturing slowed to its lowest level in 21 months. The reading came at 55.4, missing expectations and lower than March’s 57.1.
Regarding the report, the ISM Manufacturing Business Survey Committee chair Timothy Fiore said new coronavirus outbreaks overseas were “creating a near-term headwind for the US manufacturing community,” noting that some manufacturers worried “about their Asian partners’ ability to deliver reliably in the summer months.”
In the meantime, US Treasury yields are skyrocketing during the day. The US 30-year broke the 3% threshold, while the barometer for US Treasury yields, the 10-year benchmark note, surges five and a half basis points, sitting at 2.998%. That, alongside overall greenback strength, as shown by the US Dollar Index up 0.42%, at 103.649, weighed on the non-yielding metal.
Factors alongside the busy US economic docket featuring ADP and US Nonfarm Payrolls employment reports remain in the backdrop. China keeps struggling to tackle the recent coronavirus flare-up that struck Shanghai and has already spread to Beijing. Restrictions could be re-established in Shanghai, while Beijing tested millions of people on a May Day holiday, as reported by Reuters. It’s worth noting that Caixin Manufacturing and Services PMIs, plunged below expectations.
Gold Price Forecast (XAU/USD): Technical outlook
The XAU/USD’s daily chart depicts the yellow metal as neutral biased. At the time of writing, gold is trading below the 100-day moving average (DMA) at $1879.51, a level that, if it gives way to XAU/USD bears to record a daily close below it, could open the door for a drop towards the 200-DMA around $1834.45.
On the downside, gold’s first support would be the 200-DMA at $1834.45. Break below would expose an upslope trendline around $1810-15, followed by a renewed test of $1800.
Upwards, XAU/USD’s first resistance would be the 100-DMA at $1879.51. A breach of the latter would expose $1890, followed by $1900, and then April’s 29 daily high at $1919.77.
Author

Christian Borjon Valencia
FXStreet
Christian Borjon began his career as a retail trader in 2010, mainly focused on technical analysis and strategies around it. He started as a swing trader, as he used to work in another industry unrelated to the financial markets.


