Gold Price Forecast: Key levels to watch amid Russia-Ukraine peace talks – Confluence Detector
- Gold price is treading water amid a cautious market mood after the recent slump.
- Traders remain on the sidelines ahead of ECB, US inflation and Russia-Ukraine peace talks.
- Gold: Is the correction over yet? Watch out for the critical levels.

Gold price is stabilizing at lower levels, nursing heavy losses incurred on Wednesday A sudden wave of optimism hit gold price hard after Ukraine said it is ready for a comprise if Russia shows the same intent. Although markets are back to square one this Thursday, as the Ukraine crisis is unlikely to get over anytime soon. Heightened uncertainty could likely keep a floor under gold price. But traders may refrain from placing any positional bets on gold price ahead of the ECB announcements, US inflation and the much-awaited outcome of the Russia-Ukraine peace talks.
Read: War and inflation
Gold Price: Key levels to watch
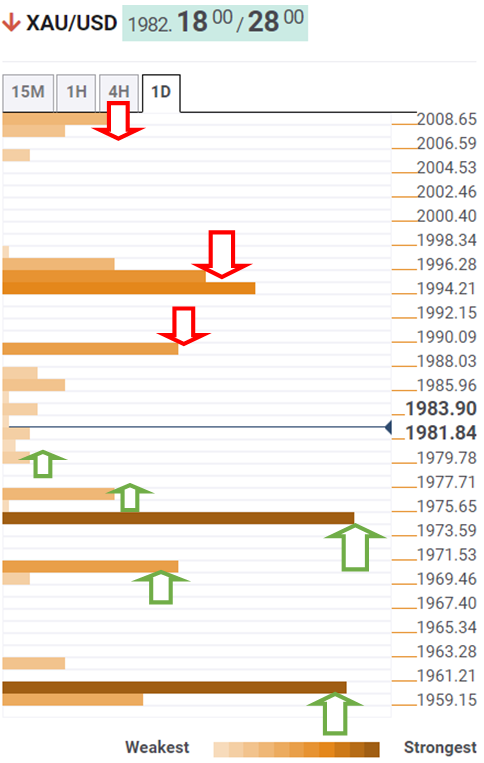
The Technical Confluences Detector shows that gold price is gyrating below powerful resistance at $1,989, which is the meeting point of the SMA5 one-day and the previous high four-hour.
Acceptance above the latter will prompt bulls to take on the dense cluster of resistance levels around $1,996, where the pivot point one-week R1, Fibonacci 23.6% one-day and pivot point one-month R1 coincide.
The next upside target is seen at the $2,000 psychological level, above which a fresh advance towards $2,007 cannot be ruled out. That level is the confluence of the Bollinger Band four-hour Middle and the Fibonacci 38.2% one-day.
Alternatively, decent support awaits around $1,981, a breach of which will call for a retest of the previous day’s low of $1,976.
If the selling pressure intensifies, then gold bears will challenge the previous month’s high near $1,974.
The previous week high of $1,970 will be next on the sellers’ radars. The last line of defense for gold optimists is seen at $1,960, which is the intersection of the previous year’s high and the pivot point one-day S1.
Despite these relevant support and resistance levels, volatility is likely to remain sky-high amid the peace talks, with wild swings in either direction likely on the table.
Here is how it looks on the tool
About Technical Confluences Detector
The TCD (Technical Confluences Detector) is a tool to locate and point out those price levels where there is a congestion of indicators, moving averages, Fibonacci levels, Pivot Points, etc. If you are a short-term trader, you will find entry points for counter-trend strategies and hunt a few points at a time. If you are a medium-to-long-term trader, this tool will allow you to know in advance the price levels where a medium-to-long-term trend may stop and rest, where to unwind positions, or where to increase your position size.
Author

Dhwani Mehta
FXStreet
Residing in Mumbai (India), Dhwani is a Senior Analyst and Manager of the Asian session at FXStreet. She has over 10 years of experience in analyzing and covering the global financial markets, with specialization in Forex and commodities markets.


