Gold Price Forecast: Is the XAU/USD correction over yet? Focus on US inflation, peace talks
- Gold sellers eye more losses amid cautious mood, firmer Treasury yields.
- The US dollar attempts a bounce ahead of inflation, Russia-Ukraine peace talks.
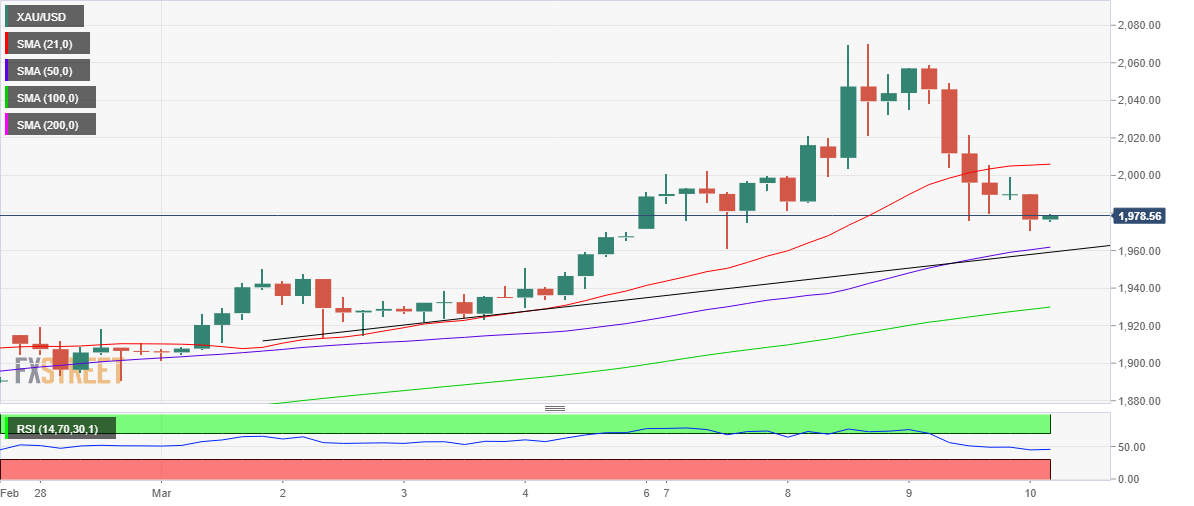
- Gold’s four-hour chart shows $1,960 is a make-or-break point for buyers.

Wednesday wound risk-off trading seen over the past one week amid a sudden wave of optimism that returned on expectations of a resolution to the Russian-Ukraine conflict. Markets cheered the comments from the Ukrainian President Volodymyr said that his country is prepared to make certain compromises, but that Russia also needs to make some compromises too. In reaction to this, the US dollar fell deeper into the red while gold and oil prices melted, as global stocks staged a staggering relief rally. The outflows from safe-haven assets such as the US Treasuries, bolstered the recent surge in the yields, exacerbating the pain in the non-yielding gold. The renewed optimism created massive volatility across the market, as investors resorted to profit-taking ahead of Thursday’s key event risks, in the form of the US inflation report, the European Central Bank (ECB) decision and the Russia-Ukraine peace talks in Turkey.
Gold price surrendered all of Tuesday’s gains, eroding $60 amid a sharp correction. The bright metal closed below the $2,000 mark on Wednesday, warranting caution for bulls. Earlier in the day, risk sentiment was lifted following the statement from the Russian Foreign Ministry, citing that their “operation’s aims do not include overthrowing Ukrainian government. “
On Thursday, gold continues to trade on the defensive, licking its wounds well below the $2,000 mark. Investors have turned cautious once again, reflective of a 0.20% drop in the S&P 500 futures. The likely outcome of the peace talks and the ECB meeting is leaving the market anxious, as they have returned to safety in the US dollar. Oil prices have regained their upward momentum, in the face of the Western oil sanctions on Russia. Meanwhile, the US House of Representatives approved the bill to aid Ukraine as well as passed the bill to ban the purchase of Russian oil. All eyes also remain on the US inflation data, which is likely to show a 7.9% rise in the Consumer Price Index (CPI) annually for February. Soaring oil prices and raging inflation is likely to keep the Fed on its hawkish trajectory.
All in all, gold’s fate hinges on the peace talks and the situation between Russia and Ukraine, as the reaction to the ECB and US inflation could be limited.
Gold Price Chart - Technical outlook
Gold: Four-hour chart
On the four-hour chart, gold price is attempting a tepid bounce, although, with the Relative Strength Index (RSI) still below the midline, the corrective downside remains intact.
There remains some room for sellers to test the critical support at $1,960, which is the confluence of the ascending 50-Simple Moving Average (SMA) and rising trendline support.
Four-hourly candlestick closing below the latter will initiate a fresh downswing towards the bullish 100-SMA at $1,930.
Further south, the $1,900 round level will come to the rescue of gold bulls.
On the flip side, if the upside resumes traction, then the immediate hurdle is seen at the $2,000 psychological mark.
The next bullish target is envisioned at the horizontal 21-SMA at $2,006, above which bulls could attempt a fresh run-up towards $2,050.
The record highs of $2,075 still remain a tough nut to crack for XAU buyers.
Author

Dhwani Mehta
FXStreet
Residing in Mumbai (India), Dhwani is a Senior Analyst and Manager of the Asian session at FXStreet. She has over 10 years of experience in analyzing and covering the global financial markets, with specialization in Forex and commodities markets.


