Gold Price Forecast: XAU/USD needs acceptance above key $1798 level for further upside – Confluence Detector


Gold price is reversing from monthly highs just ahead of the $1800 mark, as the US dollar rebounds in tandem with Treasury yields amid the upbeat market mood. Robust US corporate earnings douse fears over growing inflation risks, boosting the investors’ sentiment at the expense of the safe-haven gold. Meanwhile, failure to find a hold above the $1800 mark pushes gold price lower, as traders await the US consumer-centric data for a decisive move in the bright metal.

Read: Gold Price Forecast: XAU/USD bulls testing bears’ commitment at crucial daily resistance, US consumer data eyed

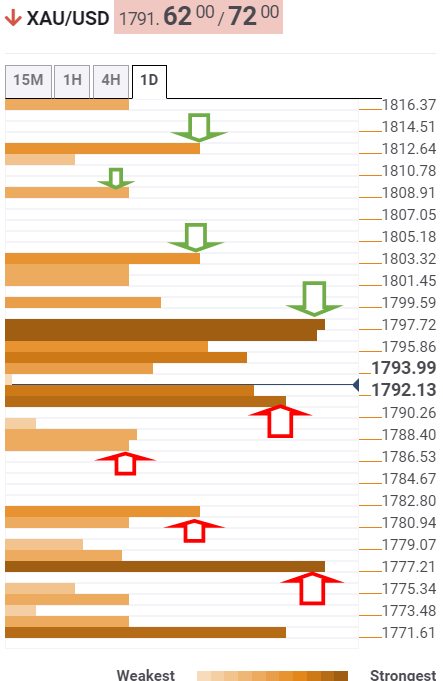
Gold Price: Key levels to watch

According to the Technical Confluences Detector, gold is consolidating the recent upsurge, lacking a follow-through upside bias, as a dense cluster of significant resistance levels around $1798 remains a tough nut to crack for the buyers.

The Fibonacci 23.6% one-day, pivot point one-week R2, SMA200 and SMA100 one-day coincide around that price zone.

Acceptance above the latter will expose the $1803 barrier, which is the confluence of the Fibonacci 161.8% one-week and pivot point one-day R1.

The next bullish target is seen at $1809, the pivot point one-day R2, above which $1812 will be on the buyers’ radars.

Alternatively, gold price sees an immediate cushion at $1790, where the Fibonacci 61.8% one-month aligns.

Additional downside pressure will prompt gold sellers to test $1787, the intersection of the previous day’s low and pivot point one-day S1.

The next significant support awaits at the previous week’s high of $1781.

Further south, the convergence of the SMA50 one-day and pivot point one-week R1 at $1778 will be the level to beat for the bears

Here is how it looks on the tool

fxsoriginal

About Technical Confluences Detector

The TCD (Technical Confluences Detector) is a tool to locate and point out those price levels where there is a congestion of indicators, moving averages, Fibonacci levels, Pivot Points, etc.  If you are a short-term trader, you will find entry points for counter-trend strategies and hunt a few points at a time. If you are a medium-to-long-term trader, this tool will allow you to know in advance the price levels where a medium-to-long-term trend may stop and rest, where to unwind positions, or where to increase your position size.

Share: Feed news

Information on these pages contains forward-looking statements that involve risks and uncertainties. Markets and instruments profiled on this page are for informational purposes only and should not in any way come across as a recommendation to buy or sell in these assets. You should do your own thorough research before making any investment decisions. FXStreet does not in any way guarantee that this information is free from mistakes, errors, or material misstatements. It also does not guarantee that this information is of a timely nature. Investing in Open Markets involves a great deal of risk, including the loss of all or a portion of your investment, as well as emotional distress. All risks, losses and costs associated with investing, including total loss of principal, are your responsibility. The views and opinions expressed in this article are those of the authors and do not necessarily reflect the official policy or position of FXStreet nor its advertisers. The author will not be held responsible for information that is found at the end of links posted on this page.

If not otherwise explicitly mentioned in the body of the article, at the time of writing, the author has no position in any stock mentioned in this article and no business relationship with any company mentioned. The author has not received compensation for writing this article, other than from FXStreet.

FXStreet and the author do not provide personalized recommendations. The author makes no representations as to the accuracy, completeness, or suitability of this information. FXStreet and the author will not be liable for any errors, omissions or any losses, injuries or damages arising from this information and its display or use. Errors and omissions excepted.

The author and FXStreet are not registered investment advisors and nothing in this article is intended to be investment advice.

Recommended content


Recommended content

Editors’ Picks

EUR/USD alternates gains with losses near 1.0720 post-US PCE

EUR/USD alternates gains with losses near 1.0720 post-US PCE

The bullish tone in the Greenback motivates EUR/USD to maintain its daily range in the low 1.070s in the wake of firmer-than-estimated US inflation data measured by the PCE.

EUR/USD News

GBP/USD clings to gains just above 1.2500 on US PCE

GBP/USD clings to gains just above 1.2500 on US PCE

GBP/USD keeps its uptrend unchanged and navigates the area beyond 1.2500 the figure amidst slight gains in the US Dollar following the release of US inflation tracked by the PCE.

GBP/USD News

Gold keeps its daily gains near $2,350 following US inflation

Gold keeps its daily gains near $2,350 following US inflation

Gold prices maintain their constructive bias around $2,350 after US inflation data gauged by the PCE surpassed consensus in March and US yields trade with slight losses following recent peaks.

Gold News

Bitcoin Weekly Forecast: BTC’s next breakout could propel it to $80,000 Premium

Bitcoin Weekly Forecast: BTC’s next breakout could propel it to $80,000

Bitcoin’s recent price consolidation could be nearing its end as technical indicators and on-chain metrics suggest a potential upward breakout. However, this move would not be straightforward and could punish impatient investors. 

Read more

Week ahead – Hawkish risk as Fed and NFP on tap, Eurozone data eyed too

Week ahead – Hawkish risk as Fed and NFP on tap, Eurozone data eyed too

Fed meets on Wednesday as US inflation stays elevated. Will Friday’s jobs report bring relief or more angst for the markets? Eurozone flash GDP and CPI numbers in focus for the Euro.

Read more

Forex MAJORS

Cryptocurrencies

Signatures