Gold Price Forecast: Firmer DXY directs XAU/USD bears towards $1,730


  • Gold price remains pressured at monthly low, down for the fifth consecutive day.
  • Recession fears, hawkish Fedspeak underpin US dollar strength amid sluggish session.
  • Anxiety ahead of Jackson Hole, G20 chatters also weigh on XAU/USD prices.

Gold price (XAU/USD) takes offers to renew monthly low near $1,750 during early Friday morning in Europe. In doing so, the bullion prices register the five-day downtrend as the US dollar bulls cheer recession woes, as well as firmer US data and hopes of the Fed’s aggression vis-à-vis rate hikes.

US Dollar Index (DXY) rises to a four-week high of 107.72, up for the third consecutive day, around 107.68 by the press time, amid multiple catalysts ranging from hawkish comments from the Fed policymakers to upbeat data at home, as well as geopolitical fears surrounding China and Europe.

Recently, Bloomberg came out with the news that Chinese President Xi Jinping and Russian President Vladimir Putin plan to attend a Group of 20 Summit to be held in Bali later this year, Indonesian President Joko Widodo said in an interview. The news also mentioned that it was the first time the leader of the world’s fourth-most populous nation confirmed both of them were planning to show up at the November summit. The news adds to the market’s anxiety and fears of more drama, which in turn contributed to the flight to safety and helped the DXY to refresh the monthly high after the release.

Previously, San Francisco Fed President Mary Daly backed either 50 basis points or a 75 basis points hike while signaling the move for the September rate decision whereas Minneapolis Federal Reserve Neel Kashkari mentioned that, per Reuters, he does not believe the county is currently in a recession.

Elsewhere, the all-time hawk St. Louis Fed President James Bullard said he is leaning towards another 75 bps rate hike in September. “Trading in futures contracts tied to the Fed's policy rate suggested investors see that rate rising to a range of 3.50%-3.75% by March of next year, but then starting to fall a few months later,” said Reuters. That said, the current range of the Fed’s benchmark rates is 2.25-2.50%.

The hawkish Fedspeak seems to have taken clues from the upbeat US Philadelphia Fed Manufacturing Survey and softer prints of the weekly Initial Jobless Claims of late.

Amid these plays, Wall Street closed mixed and exert down pressure on the S&P 500 Futures, down 0.17% intraday at the latest. Further, the US 10-year Treasury yields reverse the previous day’s retreat from the monthly high to 2.891% by the press time.

Looking forward, a light calendar can restrict XAU/USD moves but market fears and a firmer US dollar may keep bears happy ahead of the next week’s Fed Chair Jerome Powell’s speech at the Jackson Hole Symposium.

Technical analysis

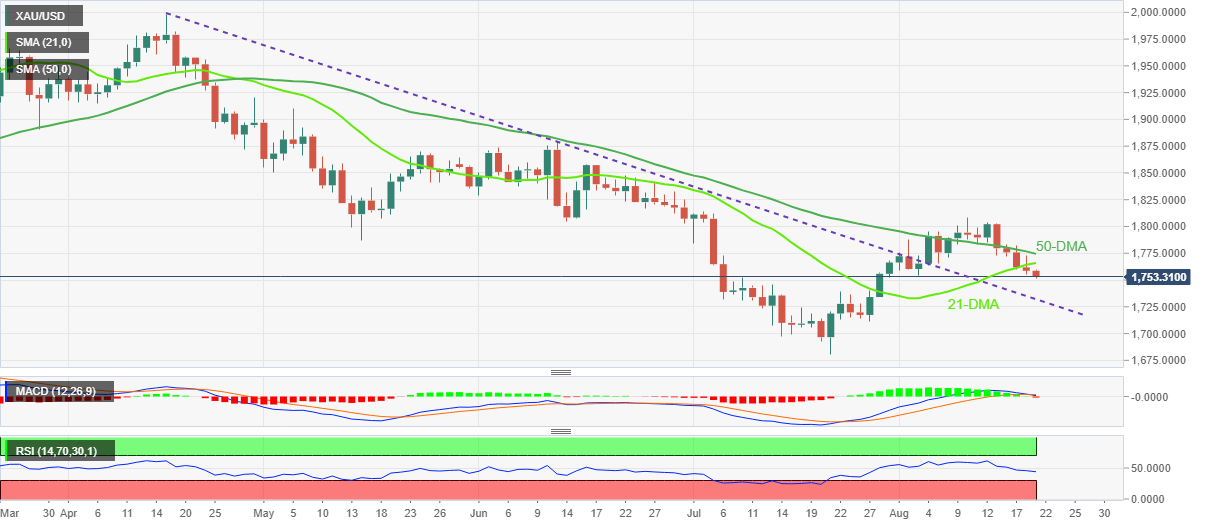
A sustained downside trading below the 50-DMA and 21-DMA joins the first bearish MACD signals in a month to keep gold sellers hopeful of witnessing further declines in the XAU/USD.

However, the previous resistance line from April, around $1,731 by the press time, appears a tough nut to crack for the metal sellers.

Also acting as a downside filter is the $1,700 threshold and the yearly bottom surrounding $1,680.

Alternatively, recovery moves need to cross the aforementioned moving averages to regain the buyer’s confidence. That said, the 21-DMA hurdle of $1,765 restricts immediate upside ahead of the 50-DMA level near $1,775.

Following that, the $1,800 round figure and the monthly peak of $1,807 will be crucial for the gold buyers to retake control.

Gold: Daily chart

Trend: Further downside expected

Additional important levels

Overview
Today last price 1753.2
Today Daily Change -5.46
Today Daily Change % -0.31%
Today daily open 1758.66
 
Trends
Daily SMA20 1766.47
Daily SMA50 1776.76
Daily SMA100 1831.13
Daily SMA200 1840.84
 
Levels
Previous Daily High 1772.46
Previous Daily Low 1755.41
Previous Weekly High 1807.93
Previous Weekly Low 1770.9
Previous Monthly High 1814.37
Previous Monthly Low 1680.91
Daily Fibonacci 38.2% 1761.92
Daily Fibonacci 61.8% 1765.95
Daily Pivot Point S1 1751.89
Daily Pivot Point S2 1745.13
Daily Pivot Point S3 1734.84
Daily Pivot Point R1 1768.94
Daily Pivot Point R2 1779.23
Daily Pivot Point R3 1785.99


Share: Feed news

Information on these pages contains forward-looking statements that involve risks and uncertainties. Markets and instruments profiled on this page are for informational purposes only and should not in any way come across as a recommendation to buy or sell in these assets. You should do your own thorough research before making any investment decisions. FXStreet does not in any way guarantee that this information is free from mistakes, errors, or material misstatements. It also does not guarantee that this information is of a timely nature. Investing in Open Markets involves a great deal of risk, including the loss of all or a portion of your investment, as well as emotional distress. All risks, losses and costs associated with investing, including total loss of principal, are your responsibility. The views and opinions expressed in this article are those of the authors and do not necessarily reflect the official policy or position of FXStreet nor its advertisers. The author will not be held responsible for information that is found at the end of links posted on this page.

If not otherwise explicitly mentioned in the body of the article, at the time of writing, the author has no position in any stock mentioned in this article and no business relationship with any company mentioned. The author has not received compensation for writing this article, other than from FXStreet.

FXStreet and the author do not provide personalized recommendations. The author makes no representations as to the accuracy, completeness, or suitability of this information. FXStreet and the author will not be liable for any errors, omissions or any losses, injuries or damages arising from this information and its display or use. Errors and omissions excepted.

The author and FXStreet are not registered investment advisors and nothing in this article is intended to be investment advice.

Recommended content


Recommended content

Editors’ Picks

EUR/USD declines toward 1.0850 after US data

EUR/USD declines toward 1.0850 after US data

EUR/USD extends its downward correction toward 1.0850 in the American session. The US Department of Labor reported that there were 222,000 first-time application for unemployment benefits last week, helping the USD hold its ground and causing the pair to stretch lower.

EUR/USD News

GBP/USD corrects to 1.2650 area on modest USD recovery

GBP/USD corrects to 1.2650 area on modest USD recovery

After touching its highest level in over a month at 1.2700, GBP/USD reversed its direction and declined toward 1.2650 on Thursday. The modest USD rebound seen following Wednesday's sharp decline makes it difficult for the pair to regain its traction.

GBP/USD News

Gold aims to retest the $2,400 area

Gold aims to retest the $2,400 area

Gold advanced toward $2,400 on Wednesday as US Treasury bond yields pushed lower following the April inflation data. The recovery in US yields combined with the US Dollar's resilience after Jobless Claims data, however, causes XAU/USD to retreat toward $2,370 on Thursday.

Gold News

Is the crypto bull run back? Premium

Is the crypto bull run back?

Bitcoin’s ascent to $65,000 seems to have breathed hope into the choppy crypto markets. Some altcoins have shot up 10% to 20% due to BTC’s comeback. Investors wonder if this is the resumption of the crypto bull run.

Read more

BRICS, the West and the rest – global trade hubs and de-dollarization

BRICS, the West and the rest – global trade hubs and de-dollarization

World trade is fragmenting into opposing blocks, warns the IMF. The BRICS and their allies are distancing themselves from the West. BRICS are attempting to de-dollarize and replace SWIFT to circumvent the threat of sanctions.

Read more

Forex MAJORS

Cryptocurrencies

Signatures