|

Gold Price Analysis: XAU/USD’s path of least resistance is down as King dollar rules – Confluence Detector

Gold (XAU/USD) is set to book the first weekly decline in three weeks, as the US dollar holds firmer near multi-month highs amid economic optimism. Recent series of upbeat US macro data combined with faster vaccine rollouts bolster expectations of quick economic recovery.

Higher Treasury yields amid hopes of additional US stimulus also offer support to the greenback, which weighs on the non-yielding gold. Looking ahead, gold traders gear up for another data-heavy US docket.

Let’s take a look at the key technical levels for trading gold ahead?

Gold Price Chart: Key resistance and support levels

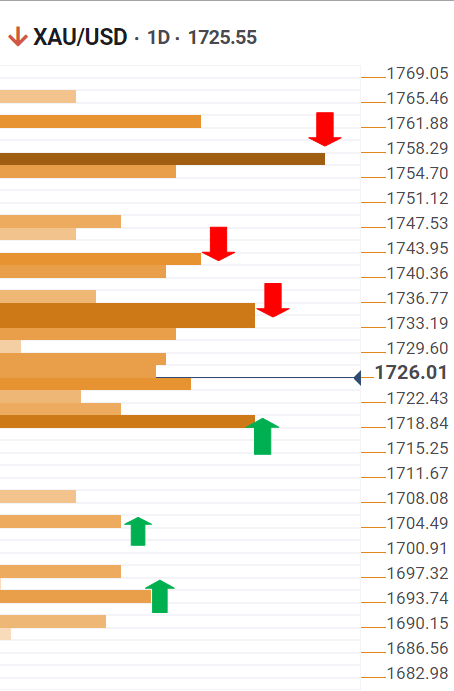
The Technical Confluences Detector shows that gold wavers near-daily lows, looking to attack the critical support at $1717, the confluence of the previous week and month lows.

The next downside target awaits at $1703, the pivot point one-week S2, below which the Fibonacci 161.8% one-week could be tested.

Further south, the sellers will aim for a $1692 cap, the intersection of the pivot point one-day S3 and Bollinger Band one-day lower.

The XAU bulls are likely to face an uphill battle, with a dense cluster of healthy resistance levels stacked up around $1730-35 region. That confluence zone comprises of SMA10 one-day, Fibonacci 61.8% one-week and SMA200 one-hour.

The convergence of the previous day high and Fibonacci 38.2% one-week at $1745 will be a tough nut to crack for the XAG bulls.

Powerful resistance at $1756, the meeting point of the previous week high and SMA200 four-hour, could the next relevant upside target.

Here is how it looks on the tool

fxsoriginal

About Technical Confluences Detector

The TCD (Technical Confluences Detector) is a tool to locate and point out those price levels where there is a congestion of indicators, moving averages, Fibonacci levels, Pivot Points, etc. Knowing where these congestion points are located is very useful for the trader, and can be used as a basis for different strategies.

Author

Dhwani Mehta

Dhwani Mehta

FXStreet

Residing in Mumbai (India), Dhwani is a Senior Analyst and Manager of the Asian session at FXStreet. She has over 10 years of experience in analyzing and covering the global financial markets, with specialization in Forex and commodities markets.

More from Dhwani Mehta
Share:

Editor's Picks

AUD/USD looks weaker, focus is back to 0.7100

AUD/USD reverses Tuesday’s gains and retreats markedly toward four-day troughs in the low 0.7100s ahead of the opening bell in Asia. The firmer tone in the Greenback weighs on the risk complex amid unabated tensions on the US-Iran front, prompting the Aussie to shed part of recent gains and refocus on the downside. Moving forward, Australian trade balance results should entertain investors early on Thursday.

Japanese Yen bounces up from lows after Japan PM Takaichi’s intervention warnings

The Japanese Yen bounced up from five-week lows against the US Dollar, turning positive on the daily chart, as Japan’s Prime Minister Sanae Takaichi warned that Tokyo is ready to take action against Yen weakness. The USD/JPY pair has pulled back from the 160.00 level, considered a line in the sand for Japanese authorities, to hit session lows at 159.55.

Gold remains under bearish pressure, looks at $4,400

Gold keeps the offered stance well in place, retreating toward the $4,430 region per troy ounce, or four-day lows, on Wednesday. The yellow metal’s retracement comes in response to escalating tensions in the Middle East, which in turn continue to drive oil prices higher while reinforcing the idea of a tighter-for-longer Fed.


XRP eyes rebound despite muted ETF demand
Ripple (XRP) rebounds above $1.23 from support at $1.20 at the time of writing on Wednesday, as the broader cryptocurrency market pares losses triggered by escalating tensions in the Middle East. Appetite for risk assets remains generally low as the United States (US) and Iran exchange fire amid a fragile ceasefire and peace negotiations.
The upside-down math of debt
In 2010, Professors Carmen Reinhart and Kenneth Rogoff published a paper, Growth in a Time of Debt, which instantly went viral. The main thesis of the paper was that once a government's debt-to-GDP ratio crosses above 90%, a financial crisis and default are around the corner.
Recession on paper: What really moves the Canadian Loonie now?

Statistics Canada handed the headline writers a gift and the analysts a headache. Real GDP shrank 0.1% on an annualized basis in the first quarter, and with the fourth quarter of 2025 revised down to a 1.0% contraction, that is two negative quarters in a row, the textbook definition of a technical recession and Canada's first since the pandemic.