|

Gold Price Analysis: XAU/USD’s path of least resistance appears to the upside – Confluence Detector

Gold (XAU/USD) is easing off three-month highs, as the bulls face a hurdle at the technical resistance near the $1798-$1799 zone. Broad-based US dollar bounce amid a risk-off mood and upbeat comments from Fed Chair Powell weigh on gold. Although the XAU bulls remain hopeful amid subdued Treasury yields. Gold traders look forward to the US ISM-NY Business Conditions and Factory Orders after the ISM Manufacturing data disappointed markets.

How is gold positioned on the technical graphs?

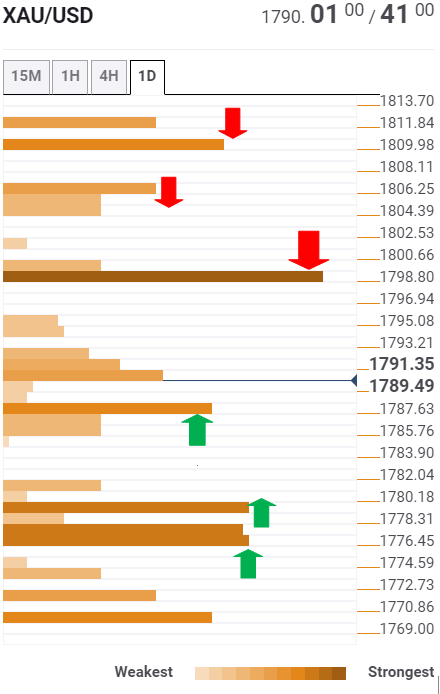
Gold Price Chart: Key resistance and support levels

The Technical Confluences Detector shows that gold is facing minor resistance around the $1793-$1795 region, which is the convergence of the previous high four-hour and Fibonacci 23.6% one-day.

The XAU buyers need to find a strong foothold above $1798, the confluence of the SMA100 one-day, previous month highs and the previous day high, in order to extend the resurgent demand.          

The next stop for the bulls is seen at the pivot point one-week S2 at $1806.

Further north, the pivot point one-month R1 at $1810 will be on the buyers’ radars.

On the flip side, strong support awaits $1787, where the SMA5 four-hour coincides with the pivot point one-week R1.

The intersection of the SMA200 one-hour, Fibonacci 61.8% one-day and SMA5 one-day at $1780 could limit the declines.

Meanwhile, the confluence of the Fibonacci 61.8% one-week, Fibonacci 23.6% one-month and SMA100 one-hour at $1776 could likely be the level to beat for the XAU bears.

Here is how it looks on the tool       

fxsoriginal

About Technical Confluences Detector

The TCD (Technical Confluences Detector) is a tool to locate and point out those price levels where there is a congestion of indicators, moving averages, Fibonacci levels, Pivot Points, etc. Knowing where these congestion points are located is very useful for the trader, and can be used as a basis for different strategies.

Author

Dhwani Mehta

Dhwani Mehta

FXStreet

Residing in Mumbai (India), Dhwani is a Senior Analyst and Manager of the Asian session at FXStreet. She has over 10 years of experience in analyzing and covering the global financial markets, with specialization in Forex and commodities markets.

More from Dhwani Mehta
Share:

Markets move fast. We move first.

Orange Juice Newsletter brings you expert driven insights - not headlines. Every day on your inbox.

By subscribing you agree to our Terms and conditions.

Editor's Picks

EUR/USD climbs toward 1.1800 on broad USD weakness

EUR/USD gathers bullish momentum and advances toward 1.1800 in the second half of the day on Tuesday. The US Dollar weakens and helps the pair stretch higher after the employment report showed that Nonfarm Payrolls declined by 105,000 in October before rising by 64,000 in November.

GBP/USD climbs to fresh two-month high above 1.3400

GBP/USD gains traction in the American session and trades at its highest level since mid-October above 1.3430. The British Pound benefits from upbeat PMI data, while the US Dollar struggles to find demand following the mixed employment figures and weaker-than-forecast PMI prints, allowing the pair to march north.

Gold extends its consolidative phase around $4,300

Gold trades in positive above $4,300 after spending the first half of the day under bearish pressure. XAU/USD capitalizes on renewed USD weakness after the jobs report showed that the Unemployment Rate climbed to 4.6% in November and the PMI data revealed a loss of growth momentum in the private sector in December. 

US Retail Sales virtually unchanged at $732.6 billion in October

Retail Sales in the United States were virtually unchanged at $732.6 billion in October, the US Census Bureau reported on Tuesday. This print followed the 0.1% increase (revised from 0.3%) recorded in September and came in below the market expectation of +0.1%.

Ukraine-Russia in the spotlight once again

Since the start of the week, gold’s price has moved lower, but has yet to erase the gains made last week. In today’s report we intend to focus on the newest round of peace talks between Russia and Ukraine, whilst noting the release of the US Employment data later on day and end our report with an update in regards to the tensions brewing in Venezuela.

BNB Price Forecast: BNB slips below $855 as bearish on-chain signals and momentum indicators turn negative

BNB, formerly known as Binance Coin, continues to trade down around $855 at the time of writing on Tuesday, after a slight decline the previous day. Bearish sentiment further strengthens as BNB’s on-chain and derivatives data show rising retail activity.