Gold Price Analysis: XAU/USD’s path of least resistance appears down – Confluence Detector

Gold (XAU/USD) holds steady below $1900 following the coronavirus vaccine optimism led Monday’s wild ride. The further upside appears elusive as the promising vaccine results imply a faster global economic recovery, as life is expected to return to normal sooner than previously expected.
Although the XAU/USD bulls may remain hopeful amid spiking virus infections and lockdown news from key Northern Hemisphere, which somewhat overshadows the vaccine optimism. Attention shifts towards the US retail spending data due later on Tuesday for fresh trading impulse amid covid developments.
How is gold positioned on the charts?
Gold: Key resistances and supports
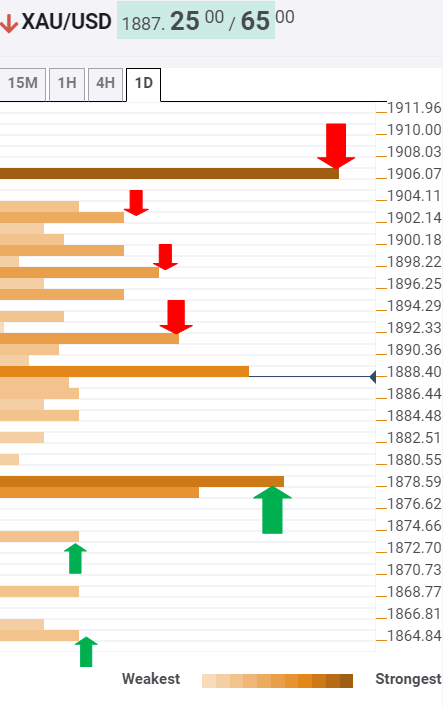
The Technical Confluences Indicator shows that the XAU bulls are likely to face a hard time to take on the upside amid a bunch of healthy resistance levels stacked up.
The immediate upside hurdle is seen at $1891, the Bollinger Band 15-minutes Upper, as the spot battles the confluence of the Fibonacci 38.2% one-month and SMA10 four-hour at $1888.50.
The buyers aim for the next resistance aligned at $1897, where the SMA10 one-day coincides with the Bollinger Band one-day Middle.
The next relevant barrier is located at $1900/01 levels, which is the intersection of the SMA200 four-hour and pivot point one-day R1.
The powerful cap at $1906 is the level to beat for the bulls. That level is the convergence of the Fibonacci 61.8% one-month, SMA50 and 100 one-day.
Alternatively, should the bears regain control, gold could see a sharp drop towards the strong cushion at $1879/77, which is the meeting point of the SMA5 one-day, Fibonacci 23.6% one-week and Fibonacci 38.2% one-day.
A break below the latter could put the Fibonacci 23.6% one-day at $1873 at risk. Acceptance under that level could expose the previous day low at $1865.
Here is how it looks on the tool
About Confluence Detector
The Confluence Detector finds exciting opportunities using Technical Confluences. The TC is a tool to locate and point out those price levels where there is a congestion of indicators, moving averages, Fibonacci levels, Pivot Points, etc. Knowing where these congestion points are located is very useful for the trader, and can be used as a basis for different strategies.
Learn more about Technical Confluence
Author

Dhwani Mehta
FXStreet
Residing in Mumbai (India), Dhwani is a Senior Analyst and Manager of the Asian session at FXStreet. She has over 10 years of experience in analyzing and covering the global financial markets, with specialization in Forex and commodities markets.


