Gold Price Analysis: XAU/USD’s bearish bias intact while below $1777 – Confluence Detector


After witnessing good two-way businesses on Thursday, Gold (XAU/USD) is holding on to recent recovery gains amid a broadly subdued US dollar and higher Treasury yields. The returns on the US debt surged after the country’s annualized GDP beat estimates with 6.4% in Q1 2021 while the weekly jobless claims hit the pandemic low. Higher yields dull gold’s attractiveness as a non-yielding investment asset.

Although the metal’s downside appears cushioned amid US President Joe Biden’s $1.8 trillion social stimulus package alongside his infrastructure spending plan.

How is gold positioned on the charts?

Gold Price Chart: Key resistance and support levels

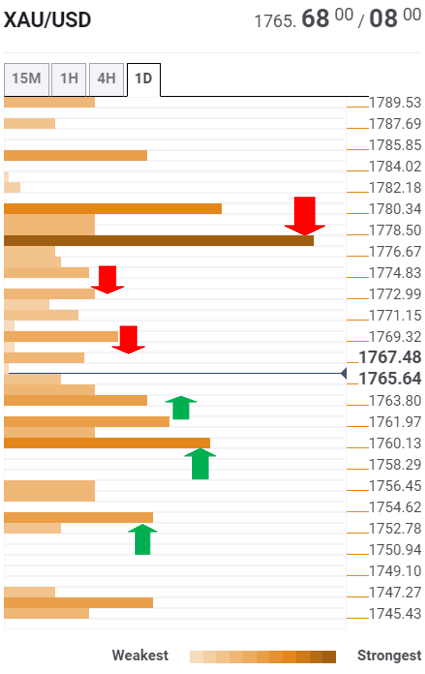
The Technical Confluences Detector shows that gold is likely to face immediate support at the previous week low of $1764.

The bears will then target the confluence of the pivot point one-week S1, the previous month high and Bollinger Band one-day Middle around $1761.

A firm break below the latter could expose the pivot point one-month R1 at $1753. That level is critical support, which the XAU bulls need to defend to stall the bearish momentum.

On the flip side, the buyers need to find acceptance above the resistance zone around $1768-$1770, which is the convergence of the Fibonacci 38.2% one-day, previous high one-hour and Bollinger Band four-hour Lower.

Further up, a bunch of minor hurdles is aligned near the $1774 region, where the SMA50 four-hour coincides with the previous high four-hour.

Powerful resistance at $1777 will be a tough nut to crack for the XAU bulls on the road to recovery. At that point, SMA100 one-hour, the Fibonacci 61.8% one-week and one-day intersect.

Here is how it looks on the tool       

fxsoriginal

About Technical Confluences Detector

The TCD (Technical Confluences Detector) is a tool to locate and point out those price levels where there is a congestion of indicators, moving averages, Fibonacci levels, Pivot Points, etc. Knowing where these congestion points are located is very useful for the trader, and can be used as a basis for different strategies.


Share: Feed news

Information on these pages contains forward-looking statements that involve risks and uncertainties. Markets and instruments profiled on this page are for informational purposes only and should not in any way come across as a recommendation to buy or sell in these assets. You should do your own thorough research before making any investment decisions. FXStreet does not in any way guarantee that this information is free from mistakes, errors, or material misstatements. It also does not guarantee that this information is of a timely nature. Investing in Open Markets involves a great deal of risk, including the loss of all or a portion of your investment, as well as emotional distress. All risks, losses and costs associated with investing, including total loss of principal, are your responsibility. The views and opinions expressed in this article are those of the authors and do not necessarily reflect the official policy or position of FXStreet nor its advertisers. The author will not be held responsible for information that is found at the end of links posted on this page.

If not otherwise explicitly mentioned in the body of the article, at the time of writing, the author has no position in any stock mentioned in this article and no business relationship with any company mentioned. The author has not received compensation for writing this article, other than from FXStreet.

FXStreet and the author do not provide personalized recommendations. The author makes no representations as to the accuracy, completeness, or suitability of this information. FXStreet and the author will not be liable for any errors, omissions or any losses, injuries or damages arising from this information and its display or use. Errors and omissions excepted.

The author and FXStreet are not registered investment advisors and nothing in this article is intended to be investment advice.

Recommended content


Recommended content

Editors’ Picks

AUD/USD tests lows near 0.6550 after dismal Aussie Retail Sales, mixed China's PMIs

AUD/USD tests lows near 0.6550 after dismal Aussie Retail Sales, mixed China's PMIs

AUD/USD is testing lows near 0.6550 after Australian Retail Sales dropped by 0.4% in March while China's NBS April PMI data came in mixed. Upbeat China's Caixin Manufacturing PMI data fails to lift the Aussie Dollar amid a softer risk tone and the US Dollar rebound. 

AUD/USD News

USD/JPY rebounds to 157.00 after Monday's suspected intervention-led crash

USD/JPY rebounds to 157.00 after Monday's suspected intervention-led crash

USD/JPY is trading close to 157.00, staging a solid rebound in the Asian session on Tuesday. The pair reverses a part of heavy losses incurred on Monday after the Japanese Yen rallied hard on probable FX market intervention by Japan's authorities. Poor Japan's jobs and Retail Sales data weigh on the Yen.

USD/JPY News

Gold prices soften as traders gear up for Fed monetary policy decision

Gold prices soften as traders gear up for Fed monetary policy decision

Gold price snaps two days of gains, yet it remains within familiar levels, with traders bracing for the US Fed's monetary policy decision on May 1. The XAU/USD retreats below the daily open and trades at $2,334, down 0.11%, courtesy of an improvement in risk appetite. 

Gold News

BNB price risks a 10% drop as Binance founder and ex-CEO Changpeng Zhao eyes Tuesday sentencing

BNB price risks a 10% drop as Binance founder and ex-CEO Changpeng Zhao eyes Tuesday sentencing

Binance Coin price is dumping, with the one-day chart showing a defined downtrend. While the broader market continues to bleed, things could get worse for BNB price ahead of Binance executive Changpeng Zhao sentencing on Tuesday, April 30.

Read more

FX market still on intervention watch

FX market still on intervention watch

Asian foreign exchange traders will be particularly attentive to any signs of Japanese intervention on Tuesday, following reports of Tokyo's involvement in the market on Monday. This intervention action propelled the yen upward from its 34-year low of 160 per dollar, setting off shockwaves of volatility.

Read more

Forex MAJORS

Cryptocurrencies

Signatures