Gold Price Analysis: XAU/USD pullback from $1,900 highlights immediate rising wedge


  • Gold snaps two-day winning streak following its pullback from $1,899.38.
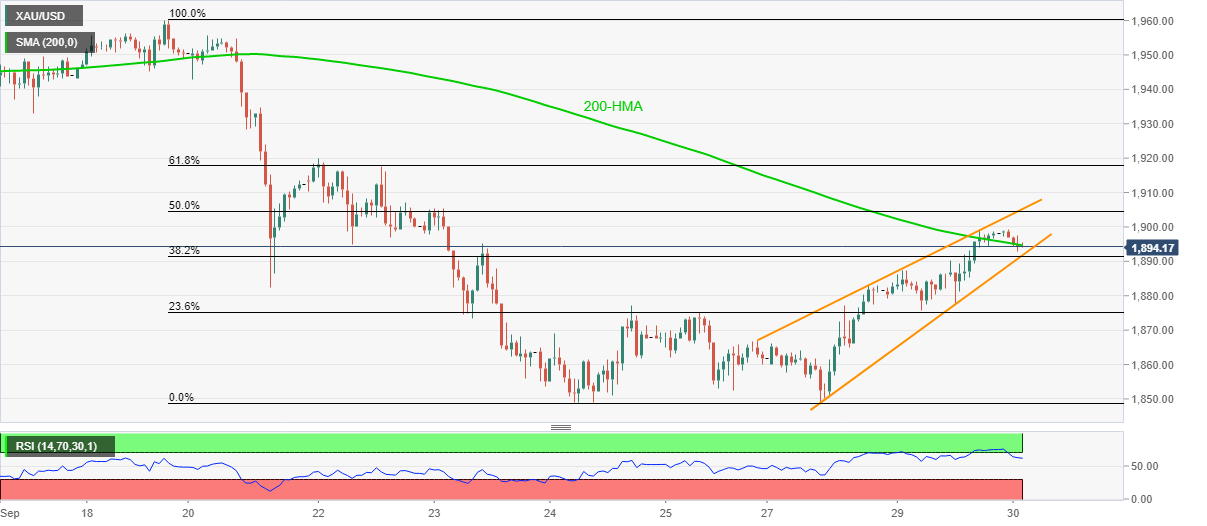
  • 200-HMA offers immediate support ahead of the bearish pattern’s lower line.
  • Bulls need a clear break beyond September 22 for confirmation.

Gold prices bounce off an intraday low of $1,892.72 to $1,896.70 amid Wednesday’s Asian session. The yellow metal recently dropped after the US presidential debate questioned market sentiment. Technically, a three-day-old rising wedge formation on the hourly chart keeps sellers hopeful even as 200-HMA probes immediate downside.

Follow: Four more years or time for change? – Live coverage

Hence, bears are waiting for a clear break of the $1,891.80 support line to confirm the bearish chart play, which in turn can drag the quote towards the monthly low near $1,850/49.

In doing so, September 24 top close to $1,877 can offer an intermediate halt while the early July top near $1,818 can lure gold traders below $1,849.

Alternatively, a clear bounce off the 200-HMA level of $1,894.60 can again attack $1,900 whereas a confluence of 50% Fibonacci retracement of September 18-24 declines and the upper line of the wedge, near $1,905, can question the gold buyers afterward.

Even if the yellow metal rises past-$1,905, the bulls are less likely to be convinced as 61.8% Fibonacci retracement and September 22 peak can probe further upside around $1,918/20.

Gold hourly chart

Trend: Pullback expected

Additional important levels

Overview
Today last price 1895.62
Today Daily Change -2.51
Today Daily Change % -0.13%
Today daily open 1898.13
 
Trends
Daily SMA20 1922.48
Daily SMA50 1944.98
Daily SMA100 1849.21
Daily SMA200 1728.9
 
Levels
Previous Daily High 1899.12
Previous Daily Low 1875.62
Previous Weekly High 1955.66
Previous Weekly Low 1848.84
Previous Monthly High 2075.32
Previous Monthly Low 1863.24
Daily Fibonacci 38.2% 1890.14
Daily Fibonacci 61.8% 1884.6
Daily Pivot Point S1 1882.79
Daily Pivot Point S2 1867.46
Daily Pivot Point S3 1859.29
Daily Pivot Point R1 1906.29
Daily Pivot Point R2 1914.46
Daily Pivot Point R3 1929.79


Share: Feed news

Information on these pages contains forward-looking statements that involve risks and uncertainties. Markets and instruments profiled on this page are for informational purposes only and should not in any way come across as a recommendation to buy or sell in these assets. You should do your own thorough research before making any investment decisions. FXStreet does not in any way guarantee that this information is free from mistakes, errors, or material misstatements. It also does not guarantee that this information is of a timely nature. Investing in Open Markets involves a great deal of risk, including the loss of all or a portion of your investment, as well as emotional distress. All risks, losses and costs associated with investing, including total loss of principal, are your responsibility. The views and opinions expressed in this article are those of the authors and do not necessarily reflect the official policy or position of FXStreet nor its advertisers. The author will not be held responsible for information that is found at the end of links posted on this page.

If not otherwise explicitly mentioned in the body of the article, at the time of writing, the author has no position in any stock mentioned in this article and no business relationship with any company mentioned. The author has not received compensation for writing this article, other than from FXStreet.

FXStreet and the author do not provide personalized recommendations. The author makes no representations as to the accuracy, completeness, or suitability of this information. FXStreet and the author will not be liable for any errors, omissions or any losses, injuries or damages arising from this information and its display or use. Errors and omissions excepted.

The author and FXStreet are not registered investment advisors and nothing in this article is intended to be investment advice.

Recommended content


Recommended content

Editors’ Picks

EUR/USD clings to daily gains above 1.0650

EUR/USD clings to daily gains above 1.0650

EUR/USD gained traction and turned positive on the day above 1.0650. The improvement seen in risk mood following the earlier flight to safety weighs on the US Dollar ahead of the weekend and helps the pair push higher.

EUR/USD News

GBP/USD recovers toward 1.2450 after UK Retail Sales data

GBP/USD recovers toward 1.2450 after UK Retail Sales data

GBP/USD reversed its direction and advanced to the 1.2450 area after touching a fresh multi-month low below 1.2400 in the Asian session. The positive shift seen in risk mood on easing fears over a deepening Iran-Israel conflict supports the pair.

GBP/USD News

Gold holds steady at around $2,380 following earlier spike

Gold holds steady at around $2,380 following earlier spike

Gold stabilized near $2,380 after spiking above $2,400 with the immediate reaction to reports of Israel striking Iran. Meanwhile, the pullback seen in the US Treasury bond yields helps XAU/USD hold its ground.

Gold News

Bitcoin Weekly Forecast: BTC post-halving rally could be partially priced in Premium

Bitcoin Weekly Forecast: BTC post-halving rally could be partially priced in

Bitcoin price shows no signs of directional bias while it holds above  $60,000. The fourth BTC halving is partially priced in, according to Deutsche Bank’s research. 

Read more

Week ahead – US GDP and BoJ decision on top of next week’s agenda

Week ahead – US GDP and BoJ decision on top of next week’s agenda

US GDP, core PCE and PMIs the next tests for the Dollar. Investors await BoJ for guidance about next rate hike. EU and UK PMIs, as well as Australian CPIs also on tap.

Read more

Forex MAJORS

Cryptocurrencies

Signatures