Gold’s weekly update: Ukraine-Russia in the spotlight once again

Since the start of the week, gold’s price has moved lower, but has yet to erase the gains made last week. In today’s report we intend to focus on the newest round of peace talks between Russia and Ukraine, whilst noting the release of the US Employment data later on day and end our report with an update in regards to the tensions brewing in Venezuela. For a rounder view we are also to provide a technical analysis of gold’s four hour chart.
Ukraine-Russia: progress on peace talks?
According to a variety of media outlets, Russian Deputy Foreign Minister Sergey Ryakbov stated that both parties are “on the verge” of a diplomatic solution to bring the war to an end. Moreover, per ABC news “U.S. administration officials signaled on Monday that a peace deal between Russia and Ukraine may be closer than ever, telling reporters on the condition of anonymity that "literally 90%" of the issues between the two warring countries had been solved.” Moreover, per POLITICO the US has offered Ukraine security guarantees similar to those it would receive as part of NATO without being accepted into the coalition. The deal in our view is structured in such a way that could pressure Ukraine to accept some territorial concessions in return for security guarantees from the US, which is something they have been vying for. In turn, the proposal on the table may be seen as Ukraine’s best chance for receiving security guarantees from the US and could thus bring the two warring nations closer to a deal. Hence, the heightened possibility of a peace deal being struck may have resulted in outflows from the precious metal given is safe haven asset status and may in turn have weighed on its price. However, as always we must stress that until we see a peace deal being signed, we remain skeptical to any developments.
US Employment data due out today.
The US Employment data for November is set to be released during today. The Non-Farm Payrolls figure is expected to come in at 40k, which would be lower than the prior figure of 119k and may tend to showcase a loosening labour market. Moreover, the unemployment rate is expected to remain unchanged at 4.4% and the average earnings growth rate is expected to slow down to 3.6% which would be lower than the prior rate of 3.8%. The prognosis points towards further easing in the US employment market and should the actual rates and figures show an even deeper-than-expected cooling of the US employment market we may see release weighing on the USD as the pressure on the Fed to continue easing its monetary policy may increase, which in turn could aid gold’s price, given their assumed inverse relationship. On the other hand, should the employment data showcase a resilient labour market, the opposite scenario may occur, with the dollar potentially gaining whilst gold’s price could face downwards pressures given the aforementioned inverse relationship with the dollar.
Venezuela could still affect Gold’s price
Turning our attention to America’s backyard, the issue with Venezuela still persists. Specifically, we would like to turn our readers’ attention to the comments made by President Trump that ground attacks “are going to start very soon” implying that a military escalation may be currently on the table and could lead to US airstrikes on Venezuelan territory. Moreover, considering the ongoing economic pressure being piled on Venezuela by attempting to curtail its economic lifeline by disrupting oil shipments, a confrontation either internally or by external forces in Venezuela may be nearing. Yet, in our view, for a significant impact to be seen on gold’s price, a direct military confrontation between the US and Venezuela may be required. Nonetheless, unless such a confrontation occurs, gold’s price may remain relatively unaffected.
Technical analysis
XAU/USD H4 Chart
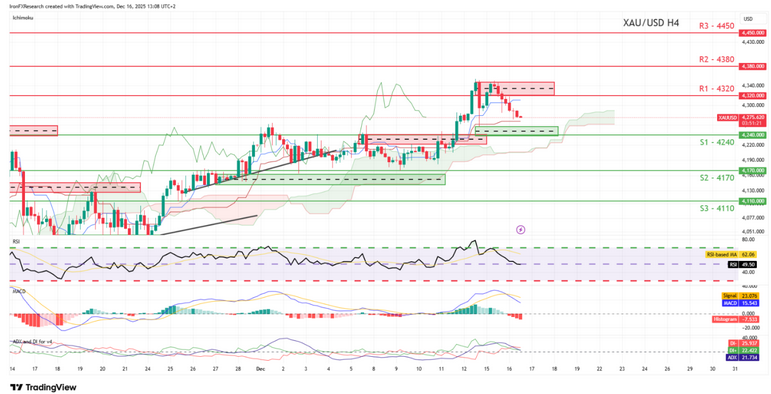
- Support: 4240 (S1),4170 (S2),4110 (S3)
- Resistance:4320 (R1), 4380 (R2), 4450 (R3)
Since our last report, gold’s price has fluctuated, clearing $4300 per troy ounce and our 4320 (R1) resistance line, but has since retraced to lower ground. Considering the indicators below our chart, where the MACD and ADX with DI tend to showcase a bearish market sentiment, we would opt for a bearish outlook for gold’s price. Moreover, the RSI has moved from above 70 to 50, implying that the bullish market sentiment guiding gold’s price may have eased. For our bearish outlook to be maintained, we would require a clear break below our 4240 (S1) support level with the next possible target for the bears, being our 4170 (S2) support line. On the other hand, for a sideways bias we would require gold’s price to remain confined between our 4240 (S1) support level and our 4240 (R1) resistance line. Lastly, for a bullish outlook, we would require a clear break above our 4320 (R1) resistance line with the next possible target for the bulls being our 4380 (R2) resistance level.
Author

Phaedros Pantelides
Independent Analyst
Mr Pantelides has graduated from the University of Reading with a degree in BSc Business Economics, where he discovered his passion for trading and analyzing global geopolitics.


