AAVE Price Forecast: AAVE slips below $186 as bearish signals outweigh the SEC investigation closure
- Aave price trades below $186 on Wednesday after failing to break through a key resistance zone.
- Price action remains subdued despite the SEC officially closing its four-year investigation into the Aave protocol.
- Falling open interest and weakening momentum signal bearish bias.

Aave (AAVE) price continues its decline, trading below $186 at the time of writing on Wednesday after a rejection at the key resistance zone. Derivatives positioning and momentum indicators suggest that bearish forces still dominate in the near term, overshadowing the positive impact of the US Securities and Exchange Commission’s (SEC) closure of its long-running investigation into the Aave protocol.
Aave founder announces closure of 4-year investigation
Stani Kulechov, founder and CEO of the Aave protocol, announced on his X account on Tuesday that the US SEC has concluded its 4-year investigation.
Kulechov said, “DeFi has faced unfair regulatory pressure in recent years. We’re glad to put this behind us as we enter a new era where developers can truly build the future of finance.”

This news is a positive development for AAVE in the long term, as the closure removes a key regulatory uncertainty, strengthens investor confidence, and allows the protocol to focus on growth and adoption without the legal overhang. However, in the short term, AAVE’s price continued its decline, sliding 3.48% that day.
Derivatives data shows bearish bias
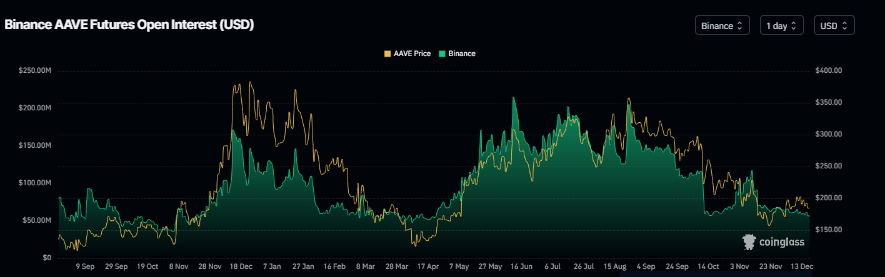
The short-term bearish price action is further supported by AAVE’s declining open interest on Binance, which stood at $56.60 million on Wednesday, near its yearly low. This declining open interest indicates that traders are closing positions and speculative interest is fading, rather than fresh buying stepping in.
AAVE Price Forecast: AAVE momentum indicators show early bearish signs
AAVE price was rejected from the 50-day Exponential Moving Average (EMA) at $198.64 on December 10 and declined 8% by Tuesday. This level coincides with the upper trendline of the falling channel, making this a key resistance zone. As of Wednesday, AAVE is trading at $185.47.
If AAVE continues its downtrend, it could extend the decline toward the daily support at $179.27. A successful close below this level could extend the correction toward the weekly support at $160.51.
The Relative Strength Index (RSI) is at 47, below the neutral level, suggesting early bearish momentum. The Moving Average Convergence Divergence (MACD) lines are converging, and a flip to a bearish crossover would further support the bearish outlook.
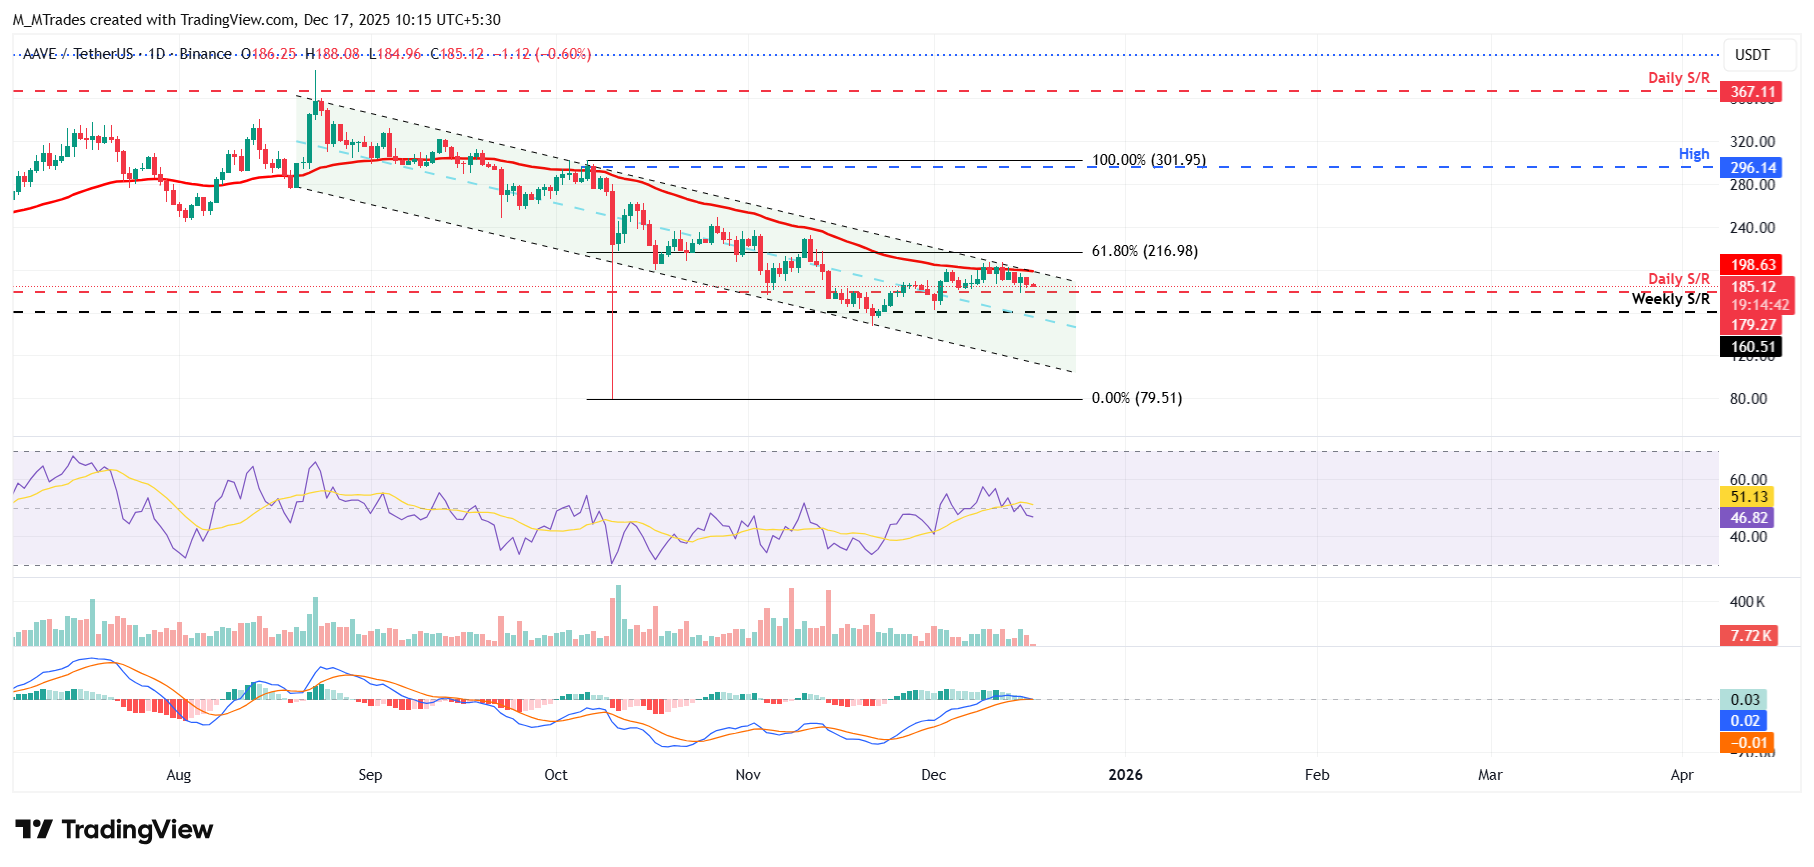
On the other hand, if AAVE recovers, it could advance toward the 50-day EMA at $198.64.
Author

Manish Chhetri
FXStreet
Manish Chhetri is a crypto specialist with over four years of experience in the cryptocurrency industry.



