|

Gold Price Analysis: XAU/USD needs to crack $1,878 to unleash the upside – Confluence Detector

Gold has been looking for a new direction after two vaccine efforts published promising results, reducing the need for additional fiscal stimulus. On the other hand, central banks remained cautious and have opened the door to providing monetary relief. The precious metal´s latest moves were mostly triggered by speculation about further funds.

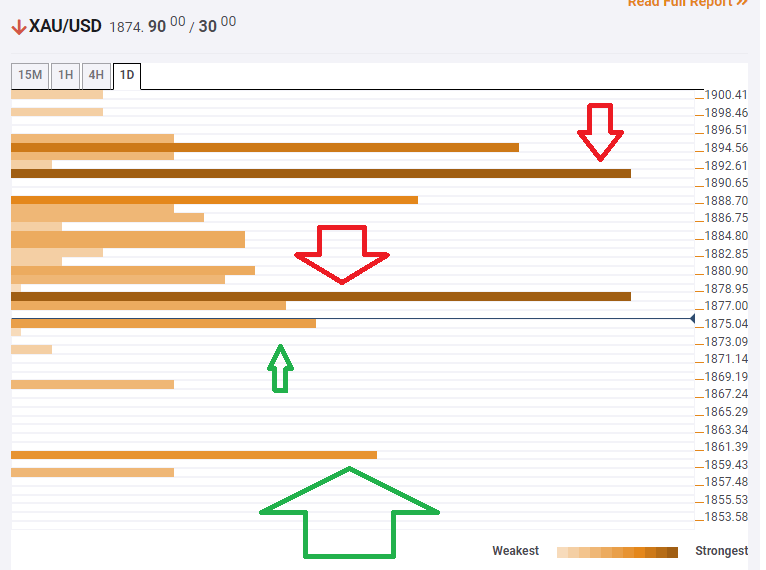
In the meantime, what are XAU/USD charts telling traders?

The Technical Confluences Indicator is showing that critical resistance awaits at $1,878, which is the convergence of the Fibonacci 23.6% one-month and the Fibonacci 23.6% one-week. 

Beyond that cap, the next substantial hurdle is at $1,891, which is the meeting point between the Pivot Point one-day Resistance 1 and the Simple Moving Average 50-4h. 

Some support awaits at $1,874, which is a cluster including the Bollinger Band 15min-Lower, the BB 4h-Lower, the BB 1h-Lowe, and the PP one-day Support 1. 

The next cushion is $1,860, which is the meeting point of the previous month's low and the PP one-day Support 3. 

Key XAU/USD resistances and supports

Confluence Detector

The Confluence Detector finds exciting opportunities using Technical Confluences. The TC is a tool to locate and point out those price levels where there is a congestion of indicators, moving averages, Fibonacci levels, Pivot Points, etc. Knowing where these congestion points are located is very useful for the trader, and can be used as a basis for different strategies.

Learn more about Technical Confluence

Author

Yohay Elam

Yohay Elam

FXStreet

Yohay is in Forex since 2008 when he founded Forex Crunch, a blog crafted in his free time that turned into a fully-fledged currency website later sold to Finixio.

More from Yohay Elam
Share:

Editor's Picks

EUR/USD seems fragile below 1.1700 as Middle East war boosts energy prices

The EUR/USD pair trades flat at around 1.1680 during the Asian trading session on Tuesday, but broadly seems vulnerable, being close to its five-week low. The major currency pair is under pressure as surging oil prices due to the United States-Israel war with Iran have increased the risks of higher inflation for the Old Continent.

GBP/USD hovers around 1.3400 with bearish pressure intact

GBP/USD edges higher after three days of losses, trading around 1.3400 during the Asian hours on Tuesday. The technical analysis of the daily chart indicates an ongoing bearish bias, as the pair trades within a descending channel pattern.

Gold stays bullish as Iran war continues to spur safe-haven flows

Gold is finding renewed bids in Asian trades on Tuesday, making another attempt to regain the $5,400 level amid persistent demand for safe-haven assets as the Iran war extends. A softer risk tone remains in play as US President Donald Trump continues to threaten deeper escalation to the ongoing war with Iran, warning that a “big wave” is yet to come.

Top Crypto Gainers: Near Protocol, Virtuals Protocol, and Morpho lead market recovery

Near Protocol, Virtuals Protocol, and Morpho are leading the market recovery with double-digit gains over the last 24 hours. Technically, NEAR extends the breakout of the falling channel pattern, VIRTUAL holds above the 50-day EMA, while MORPHO tests a crucial resistance. 

The market is not panicking it is repricing the probability distribution of Oil and time

At the end of the day, markets do not trade morality or geopolitics. They trade transmission channels. And the only channel that truly matters in this maelstrom runs through the price of energy and the time value of money.

Grass 20% bullish breakout defies broader market weakness

Grass (GRASS) is edging up above $0.30 at the time of writing on Monday. The token’s notable 20% intraday surge stands out amid heightened volatility in the broader crypto market.