Gold Price Analysis: XAU/USD needs acceptance above $1755 to unleash further gains – Confluence Detector

Gold (XAU/USD) recedes from the highest levels in two weeks above $1750, as the US dollar finds its feet after the dovish Federal Reserve (Fed) outcome smashed it across the board.
The Fed maintained its monetary policy settings and pushed back the rate hike speculation while noting that the economic outlook remains highly uncertain. Fed Chair Powell’s dovish stance sent the Treasury yields tumbling alongside the greenback. The likelihood of more funds in the market for longer benefitted the non-yielding gold.
Attention turns towards the key central banks’ events and the US weekly jobless claims data for further trading impetus.
Watch out for the key technical levels for gold.
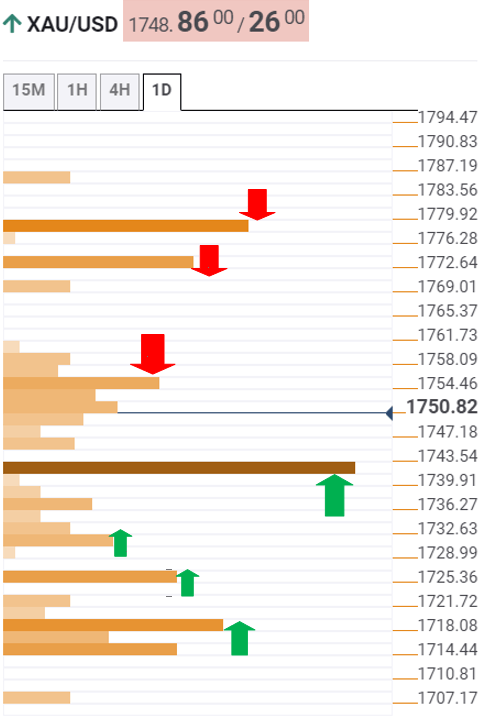
Gold Price Chart: Key resistance and support levels
The Technical Confluences Detector shows that gold needs a sustained move above the $1755 level to take on the Fed-inspired upbeat momentum.
That level is the meeting point of the previous high on four-hour and pivot point one-day R1.
The next barrier for the XAU bulls is aligned at the SMA200 four-hour of $1773.
Further up, the confluence of the Fibonacci 38.2% one-month and Pivot Point one-week R2 at $1777 is the level to beat for the buyers.
Alternatively, strong support at $1740 will guard the downside. At that level, the previous week high, SMA5 four-hour and Fibonacci 38.2% one-day coincide.
The next relevant support is seen at $1730, the convergence of the SMA100 one-hour and SMA100 four-hour.
The intersection of the Fibonacci 23.6% one-week and previous day low at $1724 could challenge the bearish commitments.
The sellers will then target the $1717 level, which is the meeting point of the previous month low and SMA10 one-day.
Here is how it looks on the tool
About Technical Confluences Detector
The TCD (Technical Confluences Detector) is a tool to locate and point out those price levels where there is a congestion of indicators, moving averages, Fibonacci levels, Pivot Points, etc. Knowing where these congestion points are located is very useful for the trader, and can be used as a basis for different strategies.
Author

Dhwani Mehta
FXStreet
Residing in Mumbai (India), Dhwani is a Senior Analyst and Manager of the Asian session at FXStreet. She has over 10 years of experience in analyzing and covering the global financial markets, with specialization in Forex and commodities markets.