|

Gold Price Analysis: XAU/USD in stasis, impending death cross may be a bear trap

  • The US dollar weakness fails to lift gold. 
  • An impending death cross may mark a major bottom.

Gold lacks clear directional bias despite an improved risk appetite and weakness in the US dollar. The yellow metal's daily chart shows key averages are set to chart a bearish crossover. 

At press time, gold is trading near $1,845 per ounce, having dropped by 0.24% on Monday. 

The US President Joe Biden announced on Tuesday that his administration is boosting weekly vaccine supply, weakening the selling pressure in stocks, and pushing the anti-risk dollar lower. Additional bearish pressure likely emerged from the International Monetary Fund's upward revision of the 2021 global growth forecasts. 

The dollar index, which tracks the greenback's value against majors, fell 0.27% to 90.27 on Tuesday and is trading flat near that level at press time. So far, however, the dollar weakness has failed to propel gold higher. 

The bulls need quick progress, as the 50-day Simple Moving Average (SMA) is on track to cross below the 200-day SMA in the next couple of days. That would confirm a death cross, a long-term bearish indicator. 

However, crossovers are lagging indicators, as SMAs are based on historical data and often mark major bottoms/tops. The metal's downtrend from the record high of $2,075 reached in August may bottom out with the impending death cross.

A move above the lower high of $1,875 created on Jan. 21 is needed to confirm a short-term bullish reversal. Meanwhle, the Jan. 18 low of $1,802 is the level to beat for the sellers. 

Daily chart
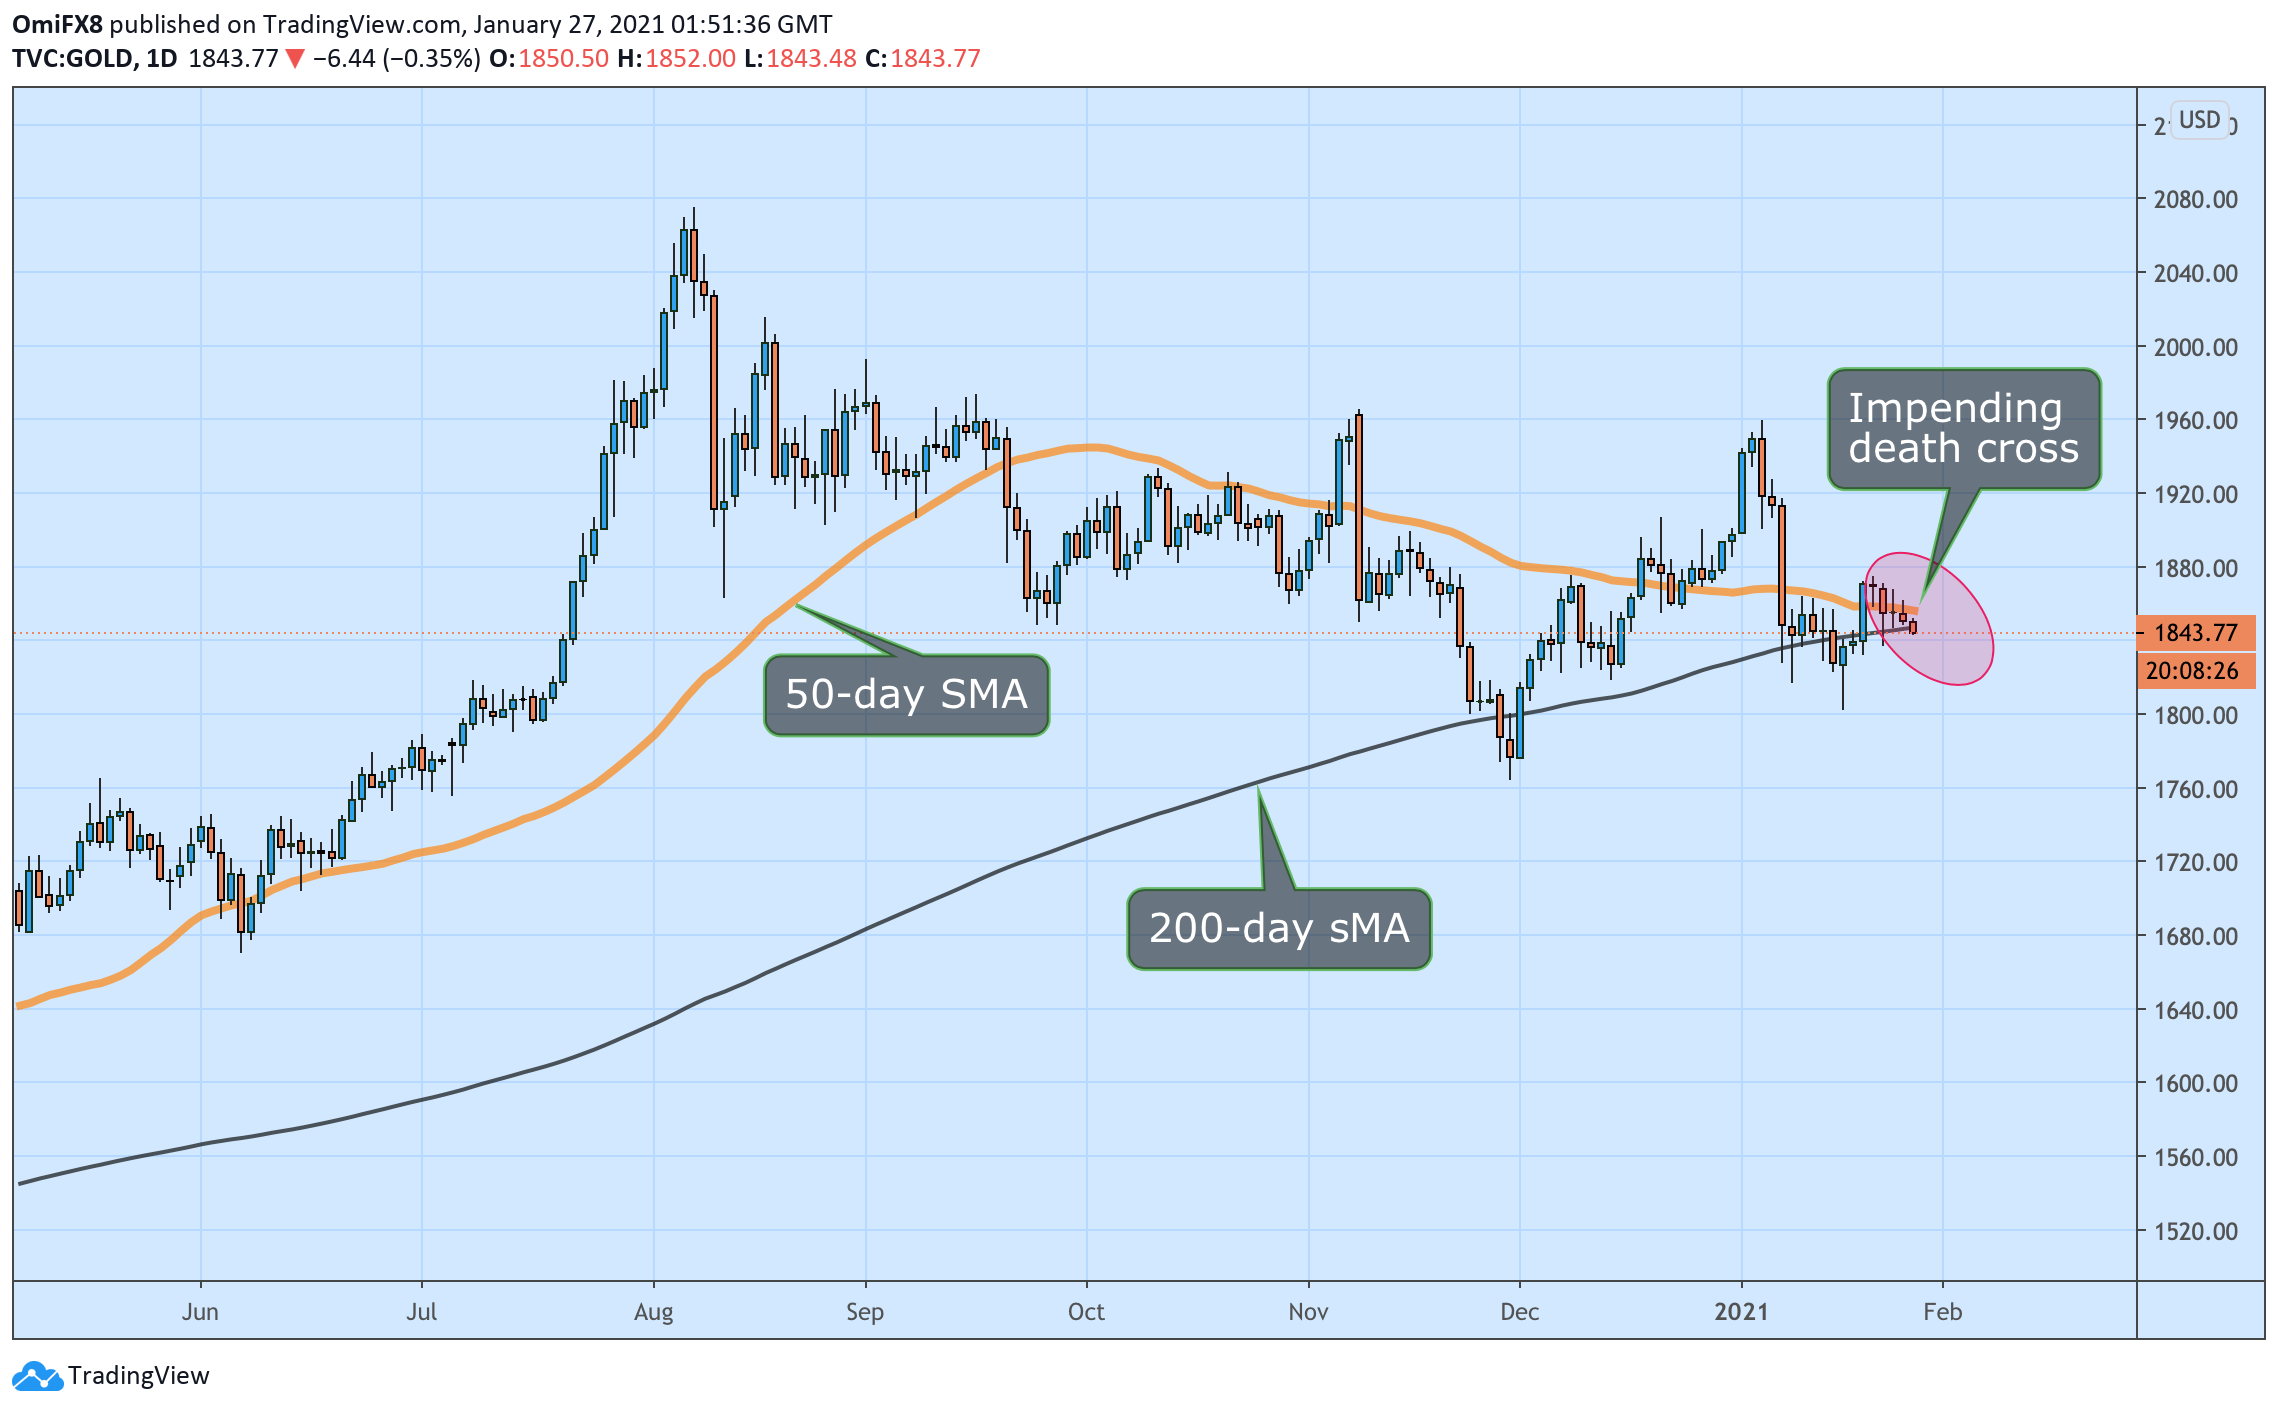
Trend: Neutral-to-bullish

Technical levels

XAU/USD

Overview
Today last price1845
Today Daily Change-4.52
Today Daily Change %-0.24
Today daily open1851.36
 
Trends
Daily SMA201873.34
Daily SMA501858.08
Daily SMA1001881.2
Daily SMA2001849.34
 
Levels
Previous Daily High1861.8
Previous Daily Low1848.46
Previous Weekly High1875.2
Previous Weekly Low1802.8
Previous Monthly High1906.87
Previous Monthly Low1775.52
Daily Fibonacci 38.2%1853.56
Daily Fibonacci 61.8%1856.7
Daily Pivot Point S11845.95
Daily Pivot Point S21840.53
Daily Pivot Point S31832.61
Daily Pivot Point R11859.29
Daily Pivot Point R21867.21
Daily Pivot Point R31872.63

Author

Omkar Godbole

Omkar Godbole

FXStreet Contributor

Omkar Godbole, editor and analyst, joined FXStreet after four years as a research analyst at several Indian brokerage companies.


More from Omkar Godbole
Share:

Editor's Picks

GBP/USD: Daily gains remain capped by 1.3650

GBP/USD leaves behind Monday’s pessimism and advances marginally on Tuesday. Cable’s humble gains, however, appear to have met quite a decent resistance in the 1.3650 zone for now, in a context of a slight selling pressure hovering around the Greenback.

EUR/USD picks some pace, retests 1.1670

EUR/USD advances modestly and revisits the 1.670 zone on turnaround Tuesday. The pair’s slight advance comes after two daily drops in a row and follows the humble decline in the US Dollar, while investors gear up for upcoming US data and the Jackson Hole Symposium.

Gold: Buyers still hold the grip

Gold navigates the middle of its daily range near $4,650 per troy ounce on Tuesday. The lack of clear direction in the yellow metal comes on the back of the widespread cautious tone among market participants, a mildly offered stance in the US Dollar and a marked decline in US Treasury yields across the curve.

Crypto Today: Bitcoin soars past $80K as Ethereum and XRP hold gains

Bitcoin (BTC) is trading above $80,000 on Tuesday. This is the highest level the Crypto King has traded since mid-May, underscoring a positive shift in investors' risk-on sentiment, liquidity conditions and the technical outlook.

Nvidia earnings: A quick look at expectations

The 2026 Q2 earnings season is nearly over for S&P 500 members, with the reporting cycle notably positive. But looming large this week is none other than AI-favorite NVIDIA (NVDA) , whose results will wrap up the reporting cycle for the Magnificent Seven group as well.

$20 billion offered, $2 billion taken: Why Treasury doubled its buyback cap

The US Treasury moved off its own calendar on Wednesday, and that is the part worth sitting with. At 12:32 GMT, the department said it would at least double the size of liquidity support buyback operations in the 10-year to 20-year and 20-year to 30-year sectors, lifting the maximum from $2 billion per operation to at least $4 billion, effective September 9 and running to November 4.















