|

Gold Price Analysis: XAU/USD eyes 38.2% Fib retracement support

  • Gold's weekly chart momentum studies have turned bearish. 
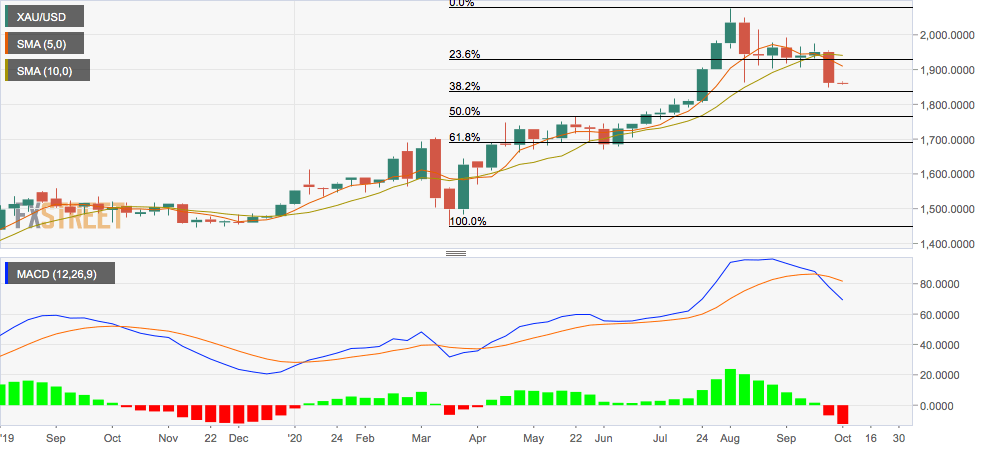
  • The metal risks falling to key support at $1,836. 

Gold looks set to extend its recent decline to $1,836 – the 38.2% Fibonacci retracement of March to August rally – as crucial technical indicators have rolled over in favor of the bears. 

The weekly chart MACD histogram, an indicator used to gauge trend strength and trend changes, is now printing a deeper bar below the zero line, a sign of the strengthening of the downward momentum. 

The 5- and 10-week simple moving averages have produced a negative crossover. 

Further, last week's bearish marubozu candle shows bearish sentiment is quite strong. 

As such, a drop to support at $1,836 looks likely. A close above the last week's high of 1,966 is needed to invalidate the bearish outlook

At press time, gold is trading largely unchanged on the day at $1860 per ounce. Prices fell by over 4% last week as the US dollar's broad-based recovery rally gathered pace. 

Weekly chart

Trend: Bearish

Technical levels

XAU/USD

Overview
Today last price1859.61
Today Daily Change-2.15
Today Daily Change %-0.12
Today daily open1861.76
 
Trends
Daily SMA201930.4
Daily SMA501942.58
Daily SMA1001845.41
Daily SMA2001724.82
 
Levels
Previous Daily High1875.23
Previous Daily Low1852.46
Previous Weekly High1955.66
Previous Weekly Low1848.84
Previous Monthly High2075.32
Previous Monthly Low1863.24
Daily Fibonacci 38.2%1861.16
Daily Fibonacci 61.8%1866.53
Daily Pivot Point S11851.07
Daily Pivot Point S21840.38
Daily Pivot Point S31828.3
Daily Pivot Point R11873.84
Daily Pivot Point R21885.92
Daily Pivot Point R31896.61

Author

Omkar Godbole

Omkar Godbole

FXStreet Contributor

Omkar Godbole, editor and analyst, joined FXStreet after four years as a research analyst at several Indian brokerage companies.

More from Omkar Godbole
Share:

Editor's Picks

EUR/USD hovers around nine-day EMA above 1.1800

EUR/USD gains ground for the second successive session, trading around 1.1820 during the Asian hours on Monday. The 14-day Relative Strength Index momentum indicator stands at 51 (neutral) after recovering above the midline, indicating stabilizing momentum. 

GBP/USD gathers strength above 1.3500 amid tariff confusion

The GBP/USD pair gains traction to around 1.3520 during the early Asian session on Monday. The US Dollar faces some selling pressure against the Cable as tariff uncertainty lingers. Traders will take more cues from the US Producer Price Index report for January, which will be published later on Friday. 

Gold climbs to fresh monthly high on trade war fears, geopolitical risks, weaker USD

Gold registered its highest-ever weekly close, above the $5,100 mark on Friday, and gains strong follow-through traction at the start of a new week. This also marks the fourth straight day of a positive move and lifts the commodity beyond the $5,150 level, or a fresh monthly peak, during the Asian session. 

Cardano braces for impact as US tariff storm brews

Cardano is down 4% at press time on Monday, entering its third consecutive day of decline. Bearish bias in Cardano’s derivatives market positional buildup aligns with rising pressure on the broader cryptocurrencymarket amid US President Donald Trump's reassessment of global tariffs and domestic conflict with the US Supreme Court. 

Liberation day take two, the tariff machine just changed gears

Let me caveat this from the outset. What we are watching is first-order mechanics, not the grand macro endgame. This is the market’s immediate reflex to a 15% Trump tariff levy dressed up as judicial drama. The Supreme Court blocked Trump tarrif hammer. The White House came back with a scalpel.

Top Crypto Losers: Zcash, Pump.fun, and LayerZero extended losses as Bitcoin loses $65,000

The cryptocurrency market starts the week in panic mode, with altcoins Zcash, Pump.fun, and LayerZero. Bitcoin falls below $65,000 as the US President Donald Trump regroups amid renewed trade policy risks.