Gold Price Analysis: XAU/USD eyes $1796 upside target amid USD weakness – Confluence Detector

Gold (XAU/USD) is on a steady recovery towards $1800, helped by the extension of the decline in the US dollar and concerns over surging covid cases in Asia. Speculative interest returns in gold while the cautious optimism, ahead of key US economic data, Fed’s decision and Biden’s likely tax hike, offers support to the yellow metal.
How is gold positioned technically?
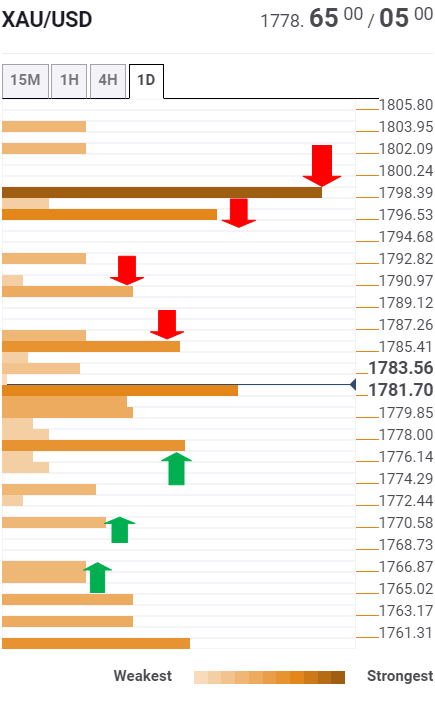
Gold Price Chart: Key resistance and support levels
The Technical Confluences Detector shows that gold needs to take out the SMA100 one-hour at $1783 decisively, in order to challenge the $1786 barrier.
That level is the confluence of the Fibonacci 38.2% one-week and Fibonacci 61.8% one-day.
The next resistance awaits at $1790, the Fibonacci 23.6% one-week.
Friday’s high at $1796 could test the bullish commitment, as a strong hurdle around $1798-$1800 needs to be recaptured to unleash additional upside.
At that point, the previous week high and pivot point one-month R2 coincide.
Alternatively, strong support is seen at $1777, the confluence of the Fibonacci 23.6% one-day and Fibonacci 61.8% one-week.
A sustained move below the latter could expose Friday’s low at $1770.
Sellers then target the $1766 cap, which is the intersection of the pivot point one-day S1 and SMA10 one-day.
Here is how it looks on the tool
About Technical Confluences Detector
The TCD (Technical Confluences Detector) is a tool to locate and point out those price levels where there is a congestion of indicators, moving averages, Fibonacci levels, Pivot Points, etc. Knowing where these congestion points are located is very useful for the trader, and can be used as a basis for different strategies.
Author

Dhwani Mehta
FXStreet
Residing in Mumbai (India), Dhwani is a Senior Analyst and Manager of the Asian session at FXStreet. She has over 10 years of experience in analyzing and covering the global financial markets, with specialization in Forex and commodities markets.


