Gold Price Analysis: XAU/USD eyes $1717 key support ahead of Powell – Confluence Detector

Gold (XAU/USD) is under pressure below $1750, courtesy of the resurgent haven demand for the US dollar across the board. The Turkish central bank upheaval over the weekend and overheating fears continue to boost the greenback’s safe-haven appeal. Also, the Fed’s decision to let a capital break on big banks expire on Friday weighs negatively on gold.
Next of note for gold remains a slew of Fedspeak due later on Monday, with the Fed Chair Jerome Powell’s speech eagerly awaited.
How is gold positioned on the charts?
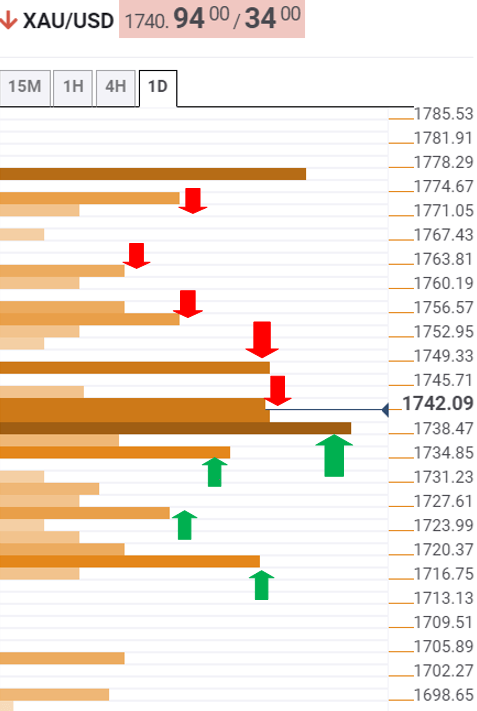
Gold Price Chart: Key resistance and support levels
The Technical Confluences Detector shows that gold is challenging the bears’ commitments at the fierce support of $1737, which is the intersection of the previous low four-hour, SMA10 four-hour and SMA5 one-day.
A breach of the last would expose the Fibonacci 61.8% one-week at $1733.
The next relevant cushion for the XAU bulls is seen at $1725, where the pivot point one-week S1 intersect with the Bollinger Band four-hour lower.
The confluence of the previous month low and Fibonacci 161.8% one-day at $1717 offers strong support, which will be a tough nut to crack for the XAU sellers.
On the flip side, a dense cluster of resistance levels is aligned around $1743, the meeting point of the SMA5 four-hour, Fibonacci 38.2% one-week and Fibonacci 23.6% one-day.
The next upside target is placed at $1747, the Friday’s high and Fibonacci 23.6% one-week.
The Fibonacci 23.6% one-week at $1754 is the next relevant barrier for the buyers.
Further up, the pivot point one-week R1 at $1762 would get tested, opening doors towards the $1772 resistance. That level is the pivot point one-day R3.
Here is how it looks on the tool
About Technical Confluences Detector
The TCD (Technical Confluences Detector) is a tool to locate and point out those price levels where there is a congestion of indicators, moving averages, Fibonacci levels, Pivot Points, etc. Knowing where these congestion points are located is very useful for the trader, and can be used as a basis for different strategies.
Author

Dhwani Mehta
FXStreet
Residing in Mumbai (India), Dhwani is a Senior Analyst and Manager of the Asian session at FXStreet. She has over 10 years of experience in analyzing and covering the global financial markets, with specialization in Forex and commodities markets.